
Technical Report: Density, not Triad Geometry, drives Allograft Rejection Signature in Reference Cervical Cancer Atera Slide
Companion to the case-study overview. Full methods, complete numerical results, supplementary figures, OLS tables, sensitivity analyses, and literature cross-references.
Summary
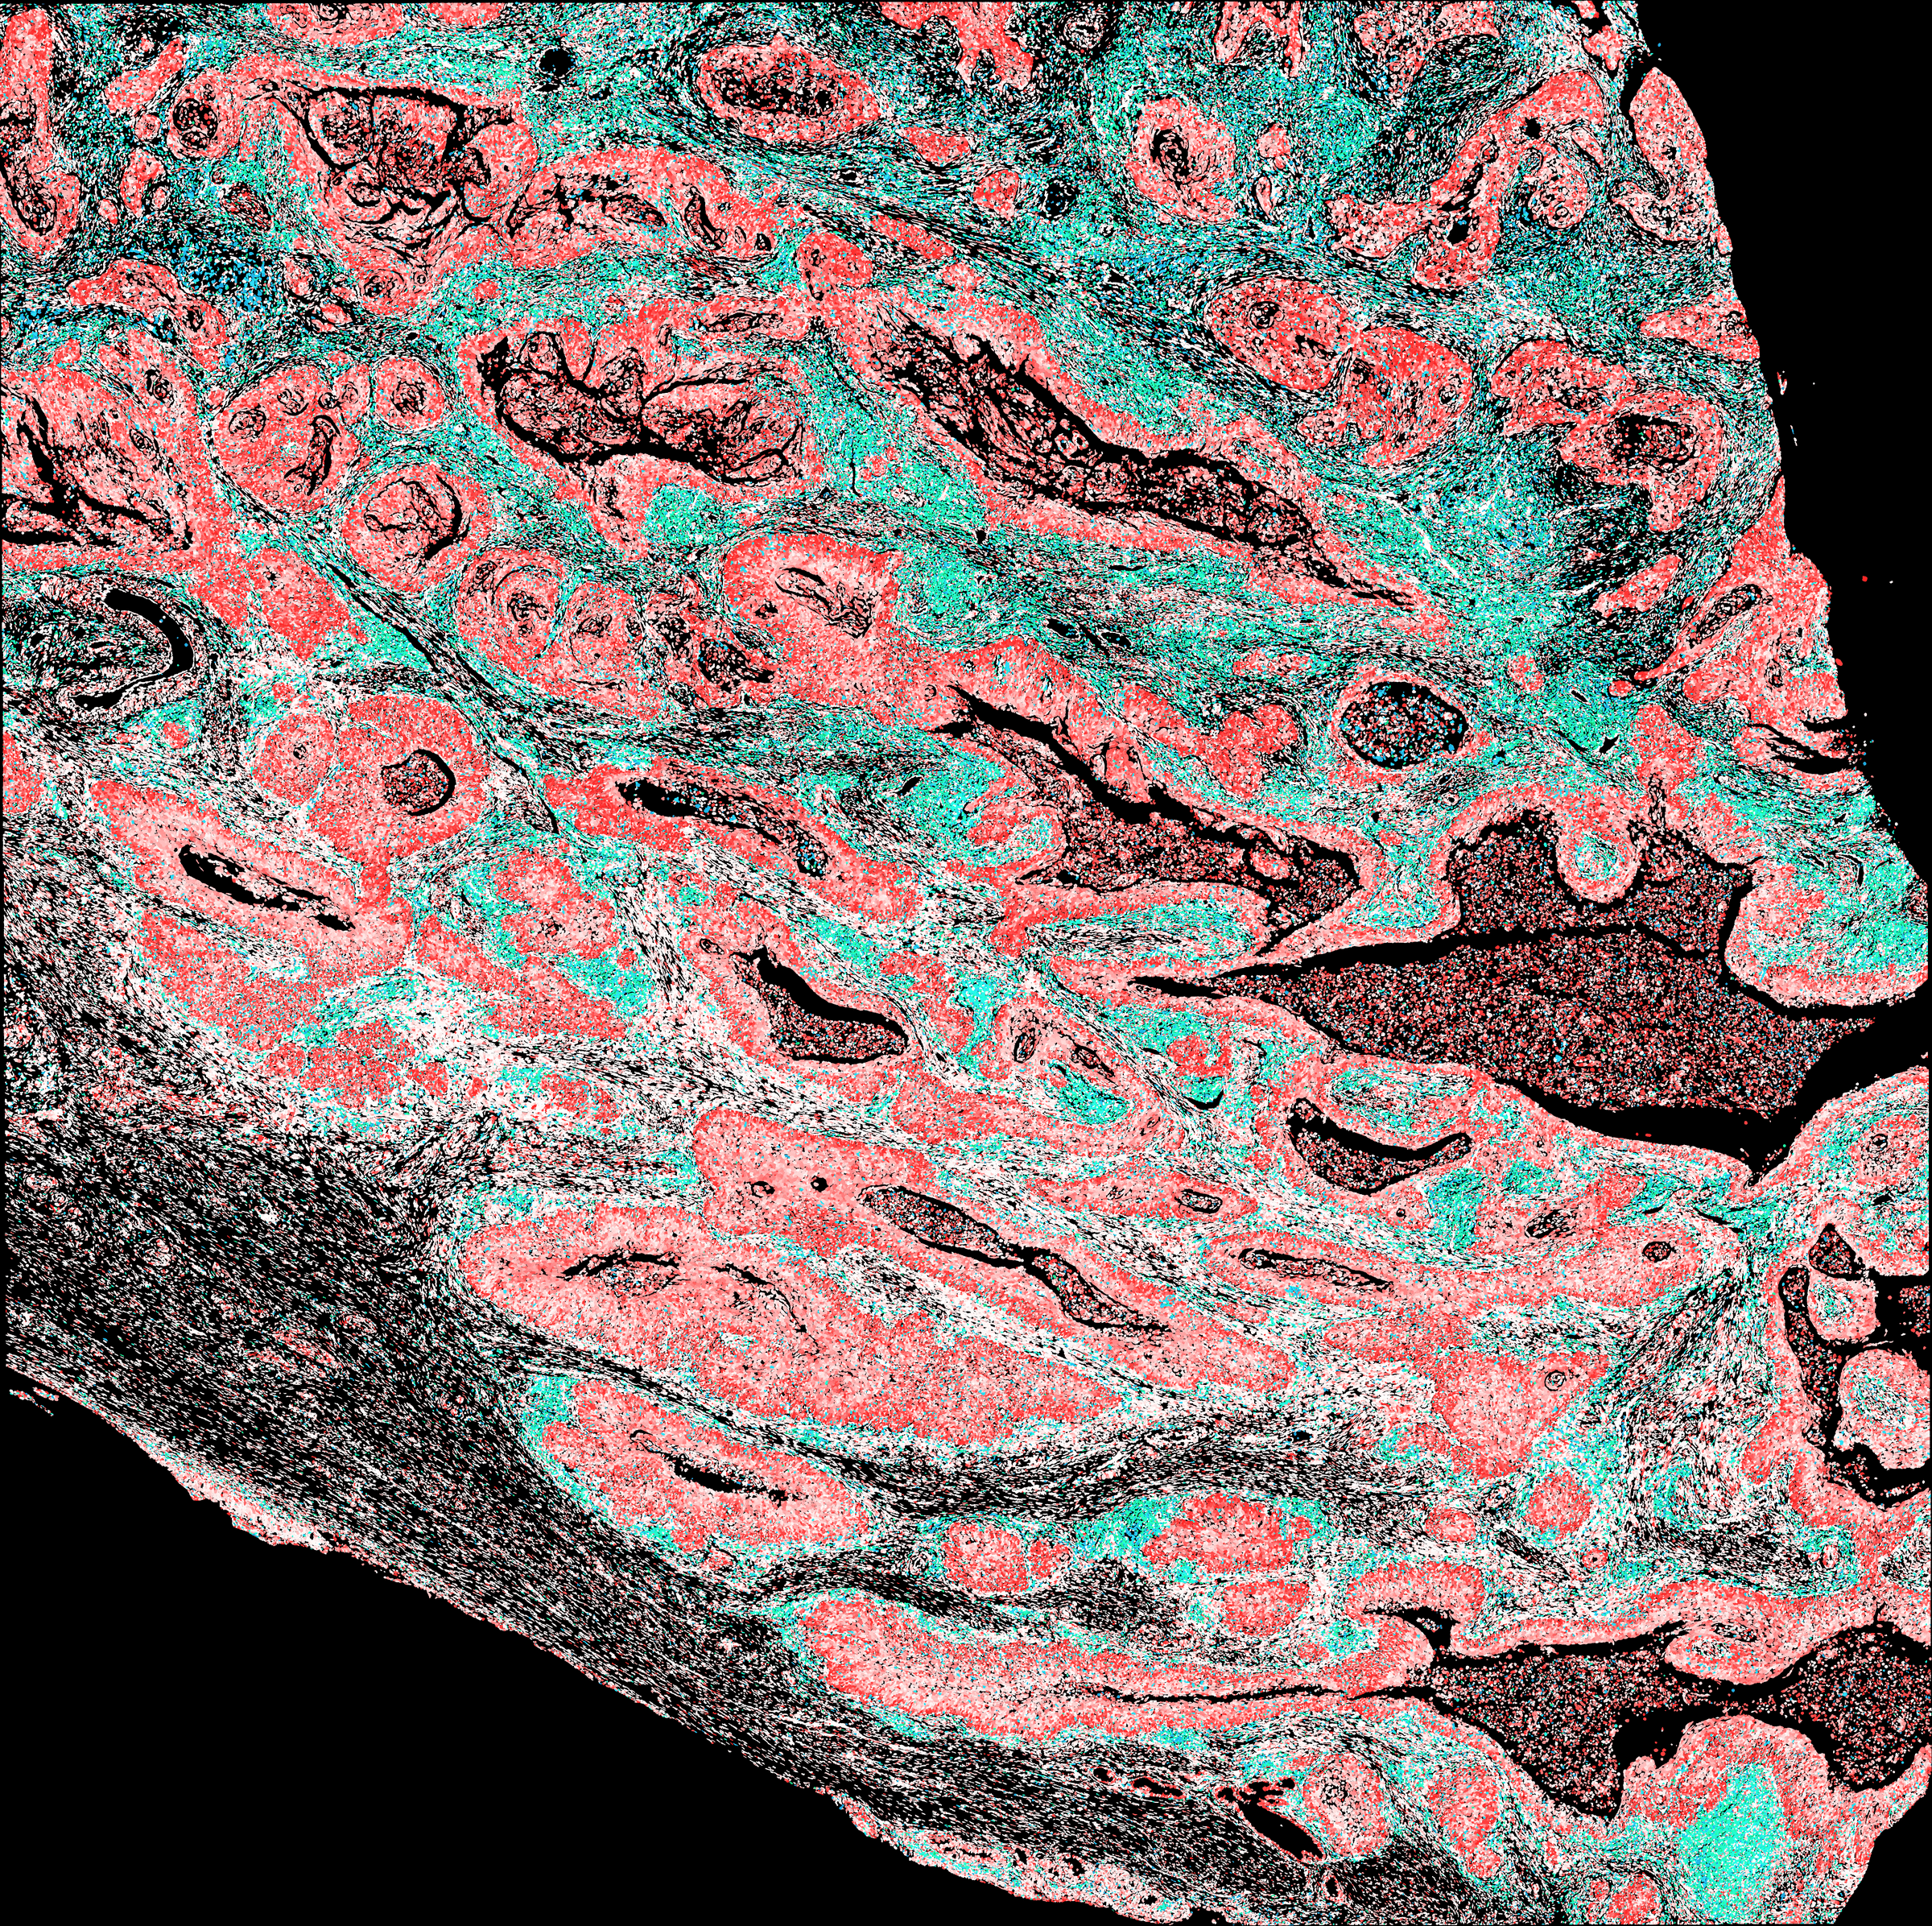
A 10x Atera WTA (~18,000 gene) FFPE cervical squamous cell carcinoma section (717,576 cells) was processed through the MiraTyper cell-type and malignancy pipeline and analysed for immune triads, the CD8⁺ / CD4⁺ / dendritic-cell co-localization motif proposed by Espinosa-Carrasco et al. (Cancer Cell 2024) as a spatial correlate of productive T-cell licensing. The section reproduced the predicted geometry: 406 triad-anchor CD8 cells along the invasive margin, conventional and plasmacytoid dendritic cells enriched within triads, and an in-triad versus out-of-triad transcriptional contrast that enriched the canonical activation programmes (allograft rejection, interferon-γ response, IL-6 / JAK / STAT3, and a CXCL9→CXCR3 ligand-receptor axis).
The activation signature did not survive density adjustment. A would-be-triad comparator (CD8 with CD4 but no dendritic cell within 20 µm) scored indistinguishably from genuine triads (Cliff’s δ = 0.09). Density-matched, cDC1-resolved Hallmark GSEA returned negative NES on every productive-immunity programme; the bulk allograft-rejection signal lost approximately 95% of its variance once density-correlated genes were censored; and cDC1 antigen-presentation machinery was inversely associated with triad proximity. Multivariable OLS adjusting for local cell, immune, and malignant density simultaneously eliminated the apparent dendritic-cell-side activation effect on HALLMARK_ALLOGRAFT_REJECTION as well. A literature review identified no prior application of these density controls to triad-anchor transcriptional readouts.
The companion tertiary-lymphoid-structure (TLS) analysis identified a candidate dendritic-cell-side mechanism. Of 138 B/T-cell aggregates, 11.6% met mature-TLS criteria. The LAMP3⁺ migratory-dendritic-cell compartment partitioned into a mature pole and a tumour-border-localized pole with reduced maturation markers, elevated interferon-stimulated genes, density-independent CD40 reduction (per-DC CD40 expression β = −0.86, p = 1.5 × 10⁻⁵), and collapsed non-canonical NF-κB output (RELB / NFKB2 / BIRC3 / BAFF target score β = −0.87, p = 3.3 × 10⁻¹⁸) despite intact LTβR expression. The transduction defect tracked proximity to malignant cells (β = −0.020, p = 1 × 10⁻⁶) rather than a measurable suppressive-cytokine field (β = −0.0008, p = 0.44). The arrested LAMP3⁺ dendritic-cell phenotype is a hybrid: a density-dependent partner deficit coexisting with density-independent CD40 reduction and downstream non-canonical NF-κB transduction failure tracking tumour proximity.
All quantitative claims are derived from a single FFPE section; multi-patient validation with matched density strata and protein-level CD40 / CD40L measurement is required.
1. Reproducing the canonical productive-triad signature
1.1 Specimen and pipeline
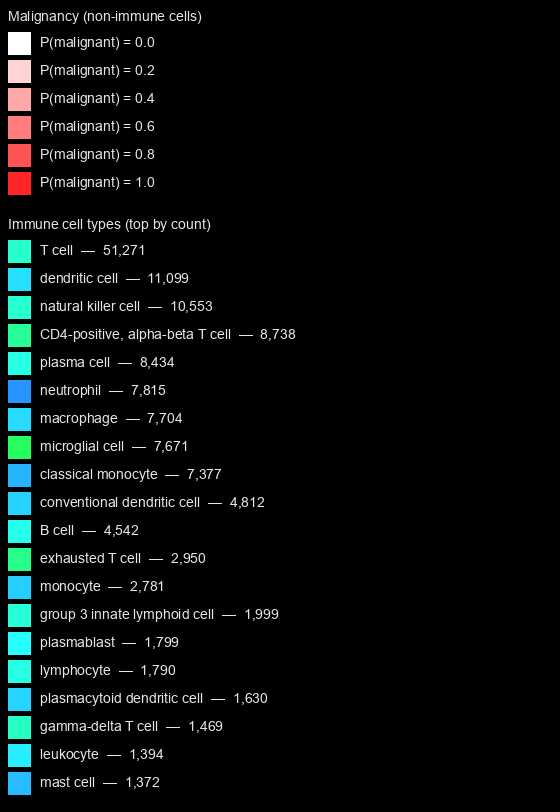
10x Atera WTA Preview FFPE cervical squamous cell carcinoma; 717,576 cells; 18,028 gene symbols; processed with miratyper --panel all --run-malignant --tissue-id UBERON:0000995 --tissue-prior-alpha 1 10 (model-registry, CPU). MiraTyper’s proprietary gene-embedding model covered 98.7% of the panel. 25.9% of cells were classified as malignant epithelium and 22.0% (157,650 cells) as immune. The whole-section rendering (Figure 1, above the Summary) encodes identity at constant brightness: non-immune cells are red with saturation scaled by p_malignant (white at 0, saturated red at 1); immune cells lie on a green-to-blue hue ramp (H 120°–240°) by 1-D metric multidimensional scaling on cell-ontology shortest-path distance among the immune types present.
1.2 Triad inventory
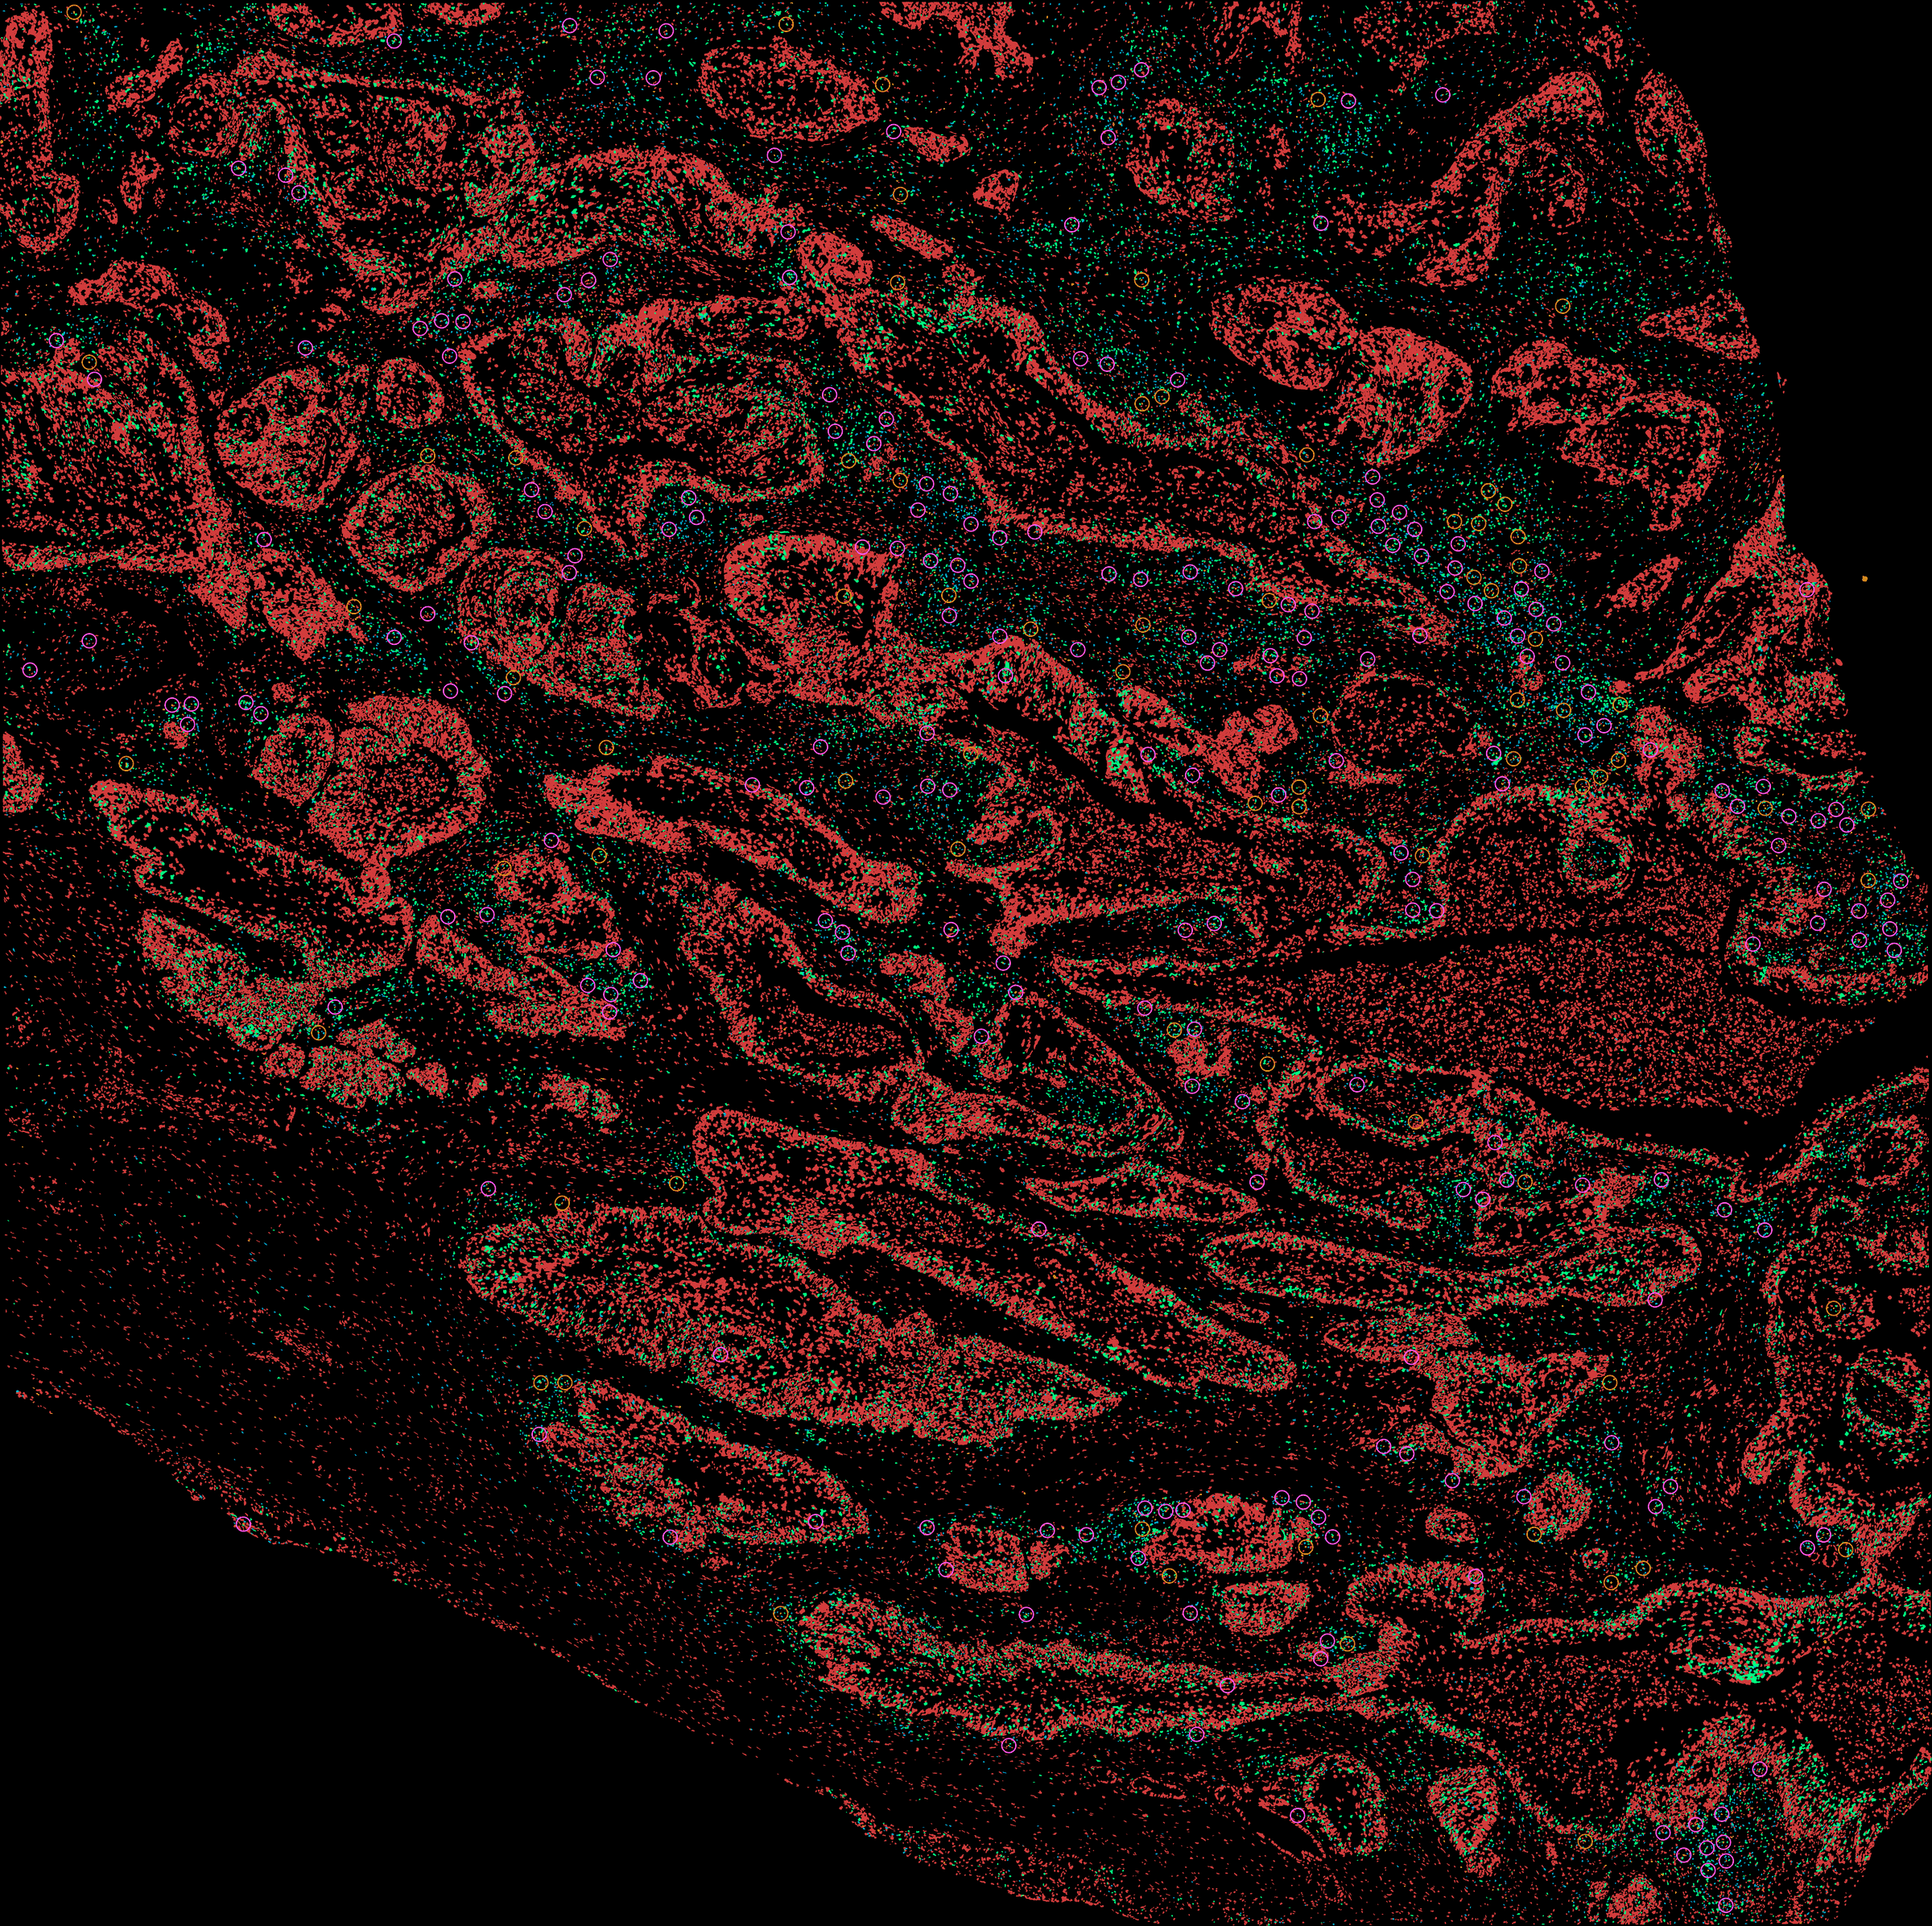
Triad anchors were defined per Espinosa-Carrasco et al. — a CD8⁺ T cell is a triad anchor if ≥1 CD4⁺ T cell and ≥1 dendritic cell lie within 20 µm — with cell identity resolved by Cell-Ontology descent (35 CD4 descendant labels, 27 CD8, 82 dendritic-cell) rather than substring matching. 406 of 1,703 CD8 cells (23.8%) were triad anchors; 275 were retained for display after 80 µm greedy thinning. Within triads, conventional dendritic cells increased from 26% to 42% of the dendritic-cell pool and plasmacytoid dendritic cells from 8.5% to 19.5%; cytotoxic and memory CD8 cells were the most triad-engaged CD8 subsets. The triads concentrated along the invasive margin between malignant lobules and immune-infiltrated stroma.

1.3 Transcriptional contrast
Whole-transcriptome Wilcoxon differential expression (in-triad versus out-of-triad, per lineage) was followed by preranked GSEA against MSigDB Hallmark and Reactome (gene sets v7.0, BH-adjusted, 1,000 gene-label permutations). The π-score ranking metric sign(log2FC) × −log10(p) × |log2FC| (Xiao et al. 2014) was used.
- CD8 in-triad cells.
IL6_JAK_STAT3_SIGNALING(NES = +1.37, q = 0.05),ALLOGRAFT_REJECTION(NES = +1.40, q = 0.05),INTERFERON_GAMMA_RESPONSE(NES = +1.31, q = 0.12),INFLAMMATORY_RESPONSE(NES = +1.25). Reactome resolved the chemokine axis:CHEMOKINE_RECEPTORS_BIND_CHEMOKINESwas the most-enriched up-pathway in CD8 (NES = +1.49, nominal p = 0.001) and contained receptors for six dendritic-cell-upregulated chemokines (CXCL9→CXCR3, CXCL12→CXCR4, CXCL13→CXCR5, CCL19→CCR7, CCL22→CCR4, CCL17→CCR4). - CD4 in-triad cells. Coordinated upregulation of CCR7/CCL19, CXCR4/CXCL12, SELL/SELPLG, and LFA-1 (ITGAL+ITGB2)/ICAM3, together with CD80→CD28 costimulation. CD80→CD28 was the only ligand-receptor pair in which ligand, receptor gene, and downstream Hallmark all moved concordantly.
- DC in-triad cells. Mature-migratory signature (CCR7/CXCR4/SELL/CD48/CD52/CXCL9 up; CD14/FCGR2A/TRAIL/CD47/CD24 down; MHC-loading machinery (B2M, TAP1, HLA-DRA) down).
This pattern matches the licensing readout reported in recent triad-adopting studies (Damle 2026 Cancer Immunol Res; Lopez-Janeiro 2026 JCI; Oh 2025 Cell Rep Med).

2. Density adjustment eliminates the apparent licensing signal
The in-triad versus out-of-triad contrast pools genuinely isolated T cells with T cells in dense lymphoid aggregates lacking a dendritic cell. Composite Hallmark scores constructed from canonical T-cell-effector and antigen-presenting-cell-interaction genes rise in dense immune neighbourhoods irrespective of mechanism, via ambient inflammation, transcript bleed in densely packed FFPE tissue, and counts/area covariates. The relevant question is therefore whether the triad signal is specific to triads or generic to immune density. Three controls were applied, on two distinct outcomes:
- The would-be-triad comparator (§2.1) and the dendritic-cell-side multivariable adjustment (§2.3) test a single composite score,
HALLMARK_ALLOGRAFT_REJECTION. This was the most-enriched activation programme in the §1 in-triad-versus-out GSEA (NES = +1.40, q = 0.05 on CD8) and is the most generic of the canonical T-cell-activation Hallmarks; it was selected as the proxy score for the cell-level density controls because of its breadth and its prominence in the baseline analysis. These two controls therefore establish that the allograft-rejection composite is fully density-confounded on this section. - The cDC1-resolved, density-matched Hallmark GSEA (§2.2) tests the broader licensing signature —
INTERFERON_GAMMA_RESPONSE,IL6_JAK_STAT3_SIGNALING,TNF_SIGNALING_VIA_NF-κB,INFLAMMATORY_RESPONSE, andALLOGRAFT_REJECTIONjointly — at the level of Hallmark gene-set enrichment in density-matched cohorts. It is the only one of the three controls that addresses the productive-licensing programmes individually rather than through the allograft composite.
The §2 heading “the licensing signal does not survive density adjustment” rests on the convergence of all three controls. §2.1 and §2.3 alone would license only the narrower claim that the allograft-rejection composite is density-confounded; the broader claim is licensed by §2.2.
2.1 Would-be-triad comparator
CD8 cells were categorized by their 20 µm neighbourhood: full triad (CD4⁺ DC⁺), would-be triad (CD4⁺ DC⁻), DC-only (CD4⁻ DC⁺), or isolated (CD4⁻ DC⁻). Per-cell HALLMARK_ALLOGRAFT_REJECTION scores were computed via scanpy.tl.score_genes on CPM-normalized log1p data (187 of 200 Hallmark genes in the panel; bin-matched random control gene set):
| CD8 neighbourhood | n | Median score |
|---|---|---|
| Triad (CD4⁺ DC⁺) | 461 | +0.136 |
| Would-be triad (CD4⁺ DC⁻) | 368 | +0.126 |
| DC-only (CD4⁻ DC⁺) | 406 | +0.135 |
| Isolated (CD4⁻ DC⁻) | 612 | +0.108 |
Triad versus would-be triad: Cliff’s δ = +0.094, Mann-Whitney p = 0.02. The effect is statistically detectable but negligible by effect size (|δ| < 0.15). DC-only CD8 cells scored identically to triad CD8 cells, indicating that the dendritic cell does not require a CD4 partner to produce the in-triad-like CD8 transcriptional pattern.

HALLMARK_ALLOGRAFT_REJECTION score by neighbourhood. Left: CD8 cells split into triad, would-be triad (CD4⁺ DC⁻), DC-only, and isolated. Triad and WBT medians are essentially equal (δ = 0.09); DC-only is essentially equal to triad. Centre: CD4 cells by the type of neighbouring CD8 (same pattern). Right: dendritic cells by triad-adjacency, showing the largest displacement (δ = +0.41) in this unadjusted comparison. The dendritic-cell-side comparison is not density-matched (triad-adjacent dendritic cells lie inside dense immune neighbourhoods by construction); the proper test is the multivariable OLS in §2.3.2.2 cDC1-resolved, density-matched analysis
cDC1 is the dendritic-cell subtype that cross-primes CD8 cells. Even if the broad triad signal is density-confounded, proximity to a cDC1 specifically might still produce a CD8 licensing signal. CD8 cells near cDC1s (n = 209) were compared with density-matched non-cDC1-near triad CD8 controls (n = 295) by Hallmark GSEA. Every productive-immunity Hallmark programme returned negative NES:
| Hallmark | NES | q |
|---|---|---|
| Interferon Gamma Response | −1.54 | 0.17 |
| TNF-α / NF-κB | −1.53 | 0.09 |
| IL-6 / JAK / STAT3 | −1.33 | 0.15 |
| Inflammatory Response | −1.09 | 0.44 |
| Allograft Rejection | −1.03 | 0.55 |
No gene survived FDR < 0.05 in the underlying differential expression. Three further results converged: (i) the bulk allograft-rejection score’s density-related variance (partial R²) fell approximately 95% (0.019 → 0.0015, no longer significant) when 9 density-correlated and 35 interferon-overlap genes were censored; (ii) cDC1 antigen-presentation-machinery score was higher the farther a cDC1 was from a triad anchor (β = +8.7 × 10⁻⁵, p = 0.02) and was suppressed where malignant cells were dense (β = −0.20 on p_malignant, p < 0.001); (iii) CD8 cytotoxicity and exhaustion scores did not track whether the nearest dendritic cell was a cDC1 (β ≈ 0.01–0.02, p ≈ 0.6).

2.3 Dendritic-cell-side multivariable adjustment
The unadjusted contrast of triad-adjacent dendritic cells (within 20 µm of a triad-anchor CD8; n = 680) versus non-triad-adjacent dendritic cells (n = 26,908) gave Cliff’s δ = +0.410 on per-cell HALLMARK_ALLOGRAFT_REJECTION (Mann-Whitney p = 1.5 × 10−74), with a monotonic gradient against distance to the nearest triad anchor. The CD8-side density controls do not adjudicate the dendritic-cell side; the same score was therefore modelled per dendritic cell against triad-adjacency and five covariates (local_cell_density_50um, local_immune_density_50um, local_malignant_density_30um, log_total_counts, cell_area).
The multivariable model returned βtriad-adjacent = +0.004 (p = 0.18, not significant). The variance was carried by local_cell_density_50um (β = +9.1 × 10⁻⁴, p ≪ 10−300; positive: more crowded neighbourhoods produce higher allograft scores irrespective of cell-type composition) and local_malignant_density_30um (β = −4.5 × 10⁻³, p ≪ 10−300; negative: dendritic cells surrounded by malignant cells are suppressed on this score). Adjustment for both eliminated the apparent triad-adjacency effect.
Single-variable density matching was tested as a sensitivity analysis. Exact matching on local_cell_density_50um alone (680 pairs) returned δ = +0.448, slightly larger than the unmatched δ. Diagnostic: triad-adjacent dendritic cells occupy dense-but-mostly-immune patches (median local cell density 131, median local malignant density 3 within 30 µm), whereas elsewhere dendritic cells matched on total cell density occupy dense-but-mostly-tumour patches (cell density 131, malignant density 19). With malignant density carrying a strong negative coefficient on the allograft score, the matched elsewhere controls have artificially deflated scores; the δ persists for the wrong reason. Matching on local_immune_density_50um instead halved the effect (δ = +0.289 at exact match). Only the multivariable OLS, with all covariates floating simultaneously, eliminated the effect. This finding motivated the §3 Test-1 OLS re-analysis (§3.3).
The same multivariable fit was applied to the CD8-side (triad vs would-be triad) and CD4-side (near-triad-CD8 vs near-WBT-CD8) contrasts. Residualizing each lineage independently against the five density covariates collapses every triad-versus-control contrast to negligible effect size.

HALLMARK_ALLOGRAFT_REJECTION by neighbourhood category, three lineages × {raw, residualized}. Columns: CD8 (left, n = 1,847; categories: triad, would-be triad, DC-only, isolated); CD4 (centre, n = 11,747; categories: near triad-CD8, near WBT-CD8, isolated); dendritic cells (right, n = 27,588; categories: triad-adjacent, elsewhere). Top row: raw scores. Bottom row: residuals after regressing each lineage’s score against local_cell_density_50um, local_immune_density_50um, local_malignant_density_30um, log_total_counts, and cell_area (focal predictor omitted from the fitted model). The triad-versus-control contrasts collapse from Cliff’s δ = +0.094 (CD8, p = 0.02) / +0.112 (CD4, p = 8.6 × 10⁻⁴) / +0.410 (DC, p = 1.5 × 10−74) on the raw scores to Cliff’s δ = −0.036 (CD8, p = 0.37) / +0.045 (CD4, p = 0.18) / +0.039 (DC, p = 0.08) on the residuals, all below the negligible-effect threshold (|δ| < 0.15). The DC residual is sensitive to whether local_malignant_density_30um is included; the CD8 and CD4 residuals are not. See §2.3.1 for the full sensitivity table and interpretation.2.3.1 Sensitivity to the local_malignant_density_30um covariate
Triad-adjacent dendritic cells sit at the tumour-immune interface by construction (median 3 malignant cells within 30 µm versus 19 for non-triad-adjacent dendritic cells, sixfold lower), and local_malignant_density_30um carries a strong negative coefficient on the outcome (β = −4.5 × 10⁻³, p ≪ 10−300). Including malignant density therefore partials out the spatial-niche feature that defines the triad pattern; the conservative question is whether the §2.3 conclusion depends on that covariate.
The residual Cliff’s δ across covariate sets, triad versus would-be triad (CD8, CD4) or triad-adjacent versus elsewhere (DC):
| Covariate set | CD4 residual δ | CD8 residual δ | DC residual δ |
|---|---|---|---|
| raw (no adjustment) | +0.112 | +0.094 | +0.410 |
| overall cell density only | +0.067 | −0.035 | +0.285 |
without local_malignant_density_30um (cell + immune density + counts + area) |
+0.041 | −0.049 | +0.232 (p = 4 × 10⁻²⁵) |
| immune + malignant density (no overall cell density) | +0.050 | −0.037 | +0.114 |
| full (all five covariates, main analysis) | +0.045 | −0.036 | +0.039 |
The CD8 and CD4 residuals stay below |δ| = 0.07 across every adjusted covariate set; the multivariable adjustment in those lineages is robust to whether malignant density is included. The DC-side residual ranges from +0.04 (full model) to +0.23 (without malignant density); the corresponding OLS βtriad-adjacent ranges from +0.004 (p = 0.18, full model) to +0.033 (p = 6 × 10⁻²⁴, without malignant density).
Two complementary readings are defensible: (i) malignant density is a legitimate confounder of HALLMARK_ALLOGRAFT_REJECTION through transcript-noise and counts-bleed effects in densely tumour-packed regions, and should be retained — the DC-side residual δ = +0.04 is the appropriate inference; (ii) malignant density over-adjusts by absorbing the spatial feature that defines the triad pattern — the DC-side residual δ = +0.23 (small-to-medium effect size) is then the appropriate inference.
The residual δ = +0.23 finding under reading (ii) is best interpreted as evidence that dendritic-cell transcriptional state varies at the tumour-immune interface, not as evidence of productive licensing. The licensing question — whether the CD8 cells in triads show licensing-readout transcriptional changes — is addressed by §2.1 (would-be-triad CD8 contrast, Cliff’s δ = +0.09) and §2.2 (cDC1-resolved density-matched Hallmark GSEA on CD8, every productive-immunity programme negative). Both CD8-side controls are unaffected by the malignant-density covariate choice (CD8 residual δ ranges from −0.035 to −0.049 across all four adjusted sets) and remain negative under any reading. §3 characterizes the DC-side spatial state variation directly: the LAMP3⁺ migratory-dendritic-cell compartment partitions into a mature pole and a tumour-border-localized arrested pole, and the discriminating-tests OLS in §3.3 retains the full covariate set including malignant density throughout.
2.4 Generalization and methodological position
A literature review identified no prior application of these density controls to triad-anchor transcriptional readouts. Damle 2026 performed partial co-occurrence normalization on the spatial side only; Lopez-Janeiro 2026, Oh 2025, Minowa 2026, and Zitti 2026 used same-sized windows or permutation nulls but did not include a local-lymphocyte-density covariate in the transcriptional models. The spatial-statistics methods literature has documented the confound and developed the relevant tools (Gil-Jimenez 2024 Nat Commun; Lau 2025 PLoS Comput Biol [TIPC]; Emons 2025 NAR [pasta]; Eliason 2026 PLoS Comput Biol [SHADE]; Chen 2023 NSCLC immune hubs), but these have not been applied to triad transcriptomes.
Recommendation. Any cell-cell-signalling claim from spatial-omics data should be reported with (i) multivariable density adjustment, (ii) dendritic-cell-subtype resolution (cDC1 / cDC2 / mregDC / pDC), (iii) a housekeeping negative control, and (iv) a cell-type-resolved multivariable model.
2.5 Per-cell functional markers indicate productive immunity in immune-dense regions and high-TLS aggregates
The §2 analysis establishes that the composite HALLMARK_ALLOGRAFT_REJECTION signal at the per-cell level around current 20 µm triads is fully explained by density-related covariates. This rules out current-triad licensing as the contributor to the composite-score signal at the §2.1–§2.3 contrast level. It does not address a separate question: whether productive immunity has occurred somewhere and the licensed and activated CD8⁺ T cells are present on the section, regardless of where the licensing event itself happened.
Two interpretations are compatible with §2:
- (A) Null reading. No productive licensing has occurred anywhere relevant to this section, and the composite-Hallmark elevation is a density artefact end-to-end. Cycling CD8 cells, effector-cytokine-producing CD8 cells, and any other cell-intrinsic readouts of productive immunity should be flat or near-flat across the section.
- (B) Active-immunity reading. Productive licensing has occurred, and the licensed and activated CD8⁺ T cells are present on the section, concentrated in the dense immune compartment. Within (B), the location of the licensing event admits two sub-readings that this single FFPE section cannot directly distinguish: (B-intratumoral) licensing happened on this section, at past 20 µm triads or now-dissolved seeding events, and the productive niche is now self-sustained (Figure 7); (B-LN) licensing happened in the tumour-draining lymph node and the licensed CD8s have circulated back and homed selectively to the dense immune compartment of the tumour section via chemokine-gradient-mediated trafficking. Both sub-readings predict the same per-cell-positivity pattern below, because they share the same end-state on the section (licensed CD8s concentrated in the dense compartment).

Interpretations A and B make different predictions for cell-intrinsic functional markers measured at the per-cell level. Under (A), proliferation and effector markers should be flat or near-flat across the section. Under (B) — either sub-reading — these markers should be elevated in immune-dense regions and inside high-TLS-score aggregates, where the licensed CD8s are concentrated.
Method. Per-cell binary positivity was computed for two cell-intrinsic marker sets on the 1,847 CD8⁺ T cells: proliferation (MKI67, TOP2A, PCNA, TYMS, MCM6) and effector cytotoxicity (IFNG, GZMA, GZMB, PRF1, NKG7). A CD8 cell was classified as proliferating if it had count ≥ 1 in at least one of the five proliferation markers, and effector⁺ by the analogous rule for effector markers. Local immune density was binned into quartiles of local_immune_density_50um; aggregate context was assigned by nearest-aggregate-centroid lookup (n = 80 aggregates) with a 150 µm radius cutoff and a top-quartile-of-tls_score definition of “high-TLS” aggregates (n = 20; threshold tls_score > 60.63).
Per-cell binary positivity was chosen over Tirosh-style composite scoring because for sparsely-detected functional markers in spatial whole-transcriptome data, composite scores are dominated by the bin-matched random-control baseline, which itself shifts with neighbourhood density. Concretely: scanpy.tl.score_genes subtracts the mean expression of a size-matched, expression-binned random control gene set, and per-cell mean-expression bins shift systematically with neighbourhood density via transcript bleed. The random-control baseline therefore tracks density, and subtracting it from the focal-gene mean cancels the small density-dependent positivity signal in the focal genes. The same gene sets scored as Tirosh composites and residualized against log_total_counts + cell_area returned misleadingly null-to-opposite-direction results — proliferation composite Q4 vs Q1 Cliff’s δ = −0.151 (p = 1 × 10⁻⁴), effector composite Q4 vs Q1 δ = −0.185 (p = 3 × 10⁻⁶) — both in the opposite direction to the per-cell positivity finding. The recommendation generalizes: spatial-omics composite scoring should be cross-checked against per-cell binary positivity for any gene set where individual-gene per-cell positivity is below ~15%.
Results. Across the section, 232 of 1,847 CD8 cells (12.6%) were proliferating and 442 (23.9%) were effector⁺ (Figure 8).
| Stratum | n | Proliferating-CD8 rate | Effector⁺ CD8 rate |
|---|---|---|---|
| Immune-density Q1 (sparse) | 374 | 5.9% | 18.4% |
| Q2 | 484 | 12.2% | 27.1% |
| Q3 | 484 | 16.1% | 25.0% |
| Immune-density Q4 (dense) | 505 | 14.5% | 24.0% |
| Q4 vs Q1 | — | OR = 2.70, Fisher p = 4.1 × 10⁻⁵ | OR = 1.39, p = 0.057 |
| Aggregate context | n | Proliferating-CD8 rate | Effector⁺ CD8 rate |
|---|---|---|---|
| Outside any aggregate | 1,294 | 12.2% | 24.3% |
| Inside other aggregate | 380 | 11.1% | 22.4% |
| Inside high-TLS-score aggregate | 173 | 18.5% | 24.3% |
| High-TLS vs outside | — | OR = 1.63, p = 0.029 | OR = 1.00 |

What these enrichments do and do not establish. The 2.5× proliferating-CD8 enrichment from immune-sparse to immune-dense regions and the 1.5× enrichment inside high-TLS-score aggregates rule out the strict null reading (A): CD8 cells in cell cycle have been licensed somewhere, and they are spatially structured on this section rather than uniformly distributed. The data do not, however, locate the licensing event. The same enrichments are consistent with intratumoral past-triad licensing (B-intratumoral) and with lymph-node licensing followed by selective homing to the dense compartment (B-LN). A single FFPE section without TCR clonality, lineage tracing, or temporal data cannot distinguish the two sub-readings on its own.
Section-level observations that weakly favour B-intratumoral over B-LN (none decisive on their own; together they constitute circumstantial evidence):
- The mature-TLS aggregate fraction (11.6%, §3.1). Mature lymphoid-organ-like architecture with germinal-centre programmes, B / T zonation, and LAMP3⁺ migratory dendritic cells is forming in situ on this section. Under pure B-LN, this in-tumour architecture would be functionally redundant — antigen presentation and CD8 priming would already be happening in the LN. The presence of any mature TLS suggests the tumour microenvironment is independently licensing-competent.
- The mature pole of the LAMP3⁺ migratory dendritic-cell partition (§3.2; n = 272). These are licensing-competent, antigen-loaded, fully mature DCs located in the tumour rather than the LN. Under pure B-LN, they have nothing functional to do. Under B-intratumoral they are the dendritic-cell-side counterpart to the productive niche.
- The arrested pole of the same partition (n = 130, §3.2) at the tumour border, with the CD40-low / non-canonical-NF-κB-collapsed phenotype characterized in §3.3. These are tumour-resident DCs that began maturation in the tumour and stalled there. Their existence is a positive observation that would not be predicted under pure B-LN.
- The original triad-versus-WBT-CD8 GSEA: proliferation modules (E2F targets, G2M checkpoint, Myc v1/v2, mitotic spindle) showed positive-NES enrichment in triad CD8s relative to would-be-triad CD8s, with q in the 0.15–0.24 range. A small but directionally consistent intratumoral signal of recent licensing activity.
The decisive distinguishing evidence — paired TCR-repertoire analysis of tumour and tumour-draining-lymph-node CD8 populations (high overlap supports B-LN; tumour-specific clonal expansions support B-intratumoral), in-situ lineage tracing, or paired-biopsy multi-patient cohorts with temporal staging — is not available from this single FFPE section, and the case study explicitly cannot resolve which sub-reading is correct.
Reframing of the §2 conclusion. Composite Hallmark scoring at the per-cell level around current 20 µm triads is density-confounded (§2.3, §2.3.1 sensitivity). The licensing question at current triads is settled by the §2.1–§2.3 controls. But productive immunity has occurred somewhere — the per-cell positivity finding rules out (A) — and the activated CD8s are concentrated in the immune-dense compartment and in high-TLS-score aggregates of this section. Whether the licensing event was intratumoral or LN-mediated cannot be determined from these data; either sub-reading of (B) is compatible.
3. A maturation-arrested LAMP3⁺ dendritic-cell substate at the malignant border
The companion TLS analysis identified a candidate dendritic-cell-side mechanism for the dissociation between triad geometry and licensing. The mechanism schematic below (Figure 9) summarizes the partition characterized in detail throughout this section: LAMP3⁺ migratory dendritic cells retain a mature CD40⁺ / non-canonical-NF-κB-intact pole away from the tumour, but at the tumour border partition into a CD40-low pole with collapsed non-canonical NF-κB target output despite intact upstream LTβR expression — arrested in maturation by tumour proximity.

3.1 Aggregate composition
138 B/T-cell aggregates were identified on the section. 11.6% met mature-TLS criteria (germinal-centre programme, LAMP3⁺ dendritic-cell presence, B/T zonation). The mature fraction lies within the published cervical range (Gorvel 2025 Cancer Immunol Res, n = 34, 100% HPV⁺: ~18% of cervical tumours carry a mature TLS, ~37.5% of TLS-positive tumours are mature) and at its immature end, consistent with the section’s HPV-negative / TP53-mutant context. Su 2025 (Front Immunol) reports that HPV-negative cervical tumours are LAMP3⁺-DC-enriched and cDC2-poor at baseline; a numerically present but functionally arrested LAMP3⁺ compartment is therefore disease-typical rather than artefactual.

3.2 LAMP3⁺ dendritic-cell partition
The LAMP3⁺ migratory-dendritic-cell compartment (top ~6% of non-pDC dendritic cells by a LAMP3 / CCR7 / CD83 / CCL22 / FSCN1 migratory score; n = 958) partitioned into a mature pole (n = 272; CCR7-high, CD83-high, CCL19/22-high, ISG-low) and an arrested pole (n = 130) with the following phenotype:
- Tumour-border localization. Median 7.6 µm to the nearest malignant cell, versus 17.1 µm for the mature pole (Cliff’s δ = −0.62).
- Reduced maturation markers. CCR7-low (δ = −0.69), CD83-low (δ = −0.49).
- Interferon-skewed. ISG-high (STAT1 / MX1 / CXCL10; δ = +0.54).
- Collapsed non-canonical NF-κB output. RELB / NFKB2 / BIRC3 / BAFF target score 0.196 versus 1.192 in the mature pole; the canonical RELA / NFKB1 / NFKBIA / TNFAIP3 arm was essentially unchanged.
- Spatially partner-depleted. Within 30 µm, the arrested dendritic cells were depleted of the cell types that ligate LTβR / CD40 / RANK to drive the non-canonical arm (B cells, CD4 naïve/memory T cells, Tfh-like T cells, FRC-like fibroblasts).
The component observations exist in the literature (Minowa 2026: ISG⁺ dendritic-cell cluster distinct from CCR7⁺ dendritic cells in interferon-rich CD8-effector regions; Lee 2024 Nat Commun: tumour-retained CCR7⁺ dendritic cells progressively lose antigen-presentation programmes with dwell time; Lei 2023 Nat Commun: CD4 help via CD40 required for cDC1 licensing; Yang 2024: mregDC non-canonical NF-κB is normally active, so a collapse is a genuine departure). They have not been previously combined into a single maturation-arrested LAMP3⁺ substate.

3.3 Discriminating tests, partner-scarcity versus active immunosuppression
The arrested cluster was reconstructed locally (130 cells); a validation gate confirmed reproduction of the phenotype on all four criteria (border distance, CCR7-low, CD83-low, ISG-high). Three Xenium-sensitivity-aware tests followed: (i) ligand⁺-neighbour engagement scoring on the LTβR and CD40 axes with receptor expression measured on the dendritic cell; (ii) per-DC and 30 µm-field active-suppression panel (PDCD1LG2, CD274, IL10, TGFB1, IDO1) as the explicit alternative model; (iii) upstream-receptor (LTBR, CD40) versus non-canonical-target (RELB, NFKB2, BIRC3, BAFF) decomposition.
Each outcome was modelled by ordinary least squares contrasting arrested versus mature (n = 130 versus 272; covariates log_total_counts, cell_area, local_cell_density_50um, local_immune_density_50um, local_malignant_density_30um). Covariate balance confirmed that single-covariate matching is insufficient for this contrast: arrested versus mature median local_immune_density_50um 6 versus 35 and local_malignant_density_30um 14 versus 3 (opposite directions).
Partner deficit (Test 1). Total LTB⁺ neighbours: δ = −0.5 to −0.7 across 15/20/30 µm; CD40LG⁺ neighbours: δ = −0.3 to −0.5; LTB⁺ neighbours from a licensing provider (B cell / CD4 T cell / fibroblast): δ = −0.33 at 20 µm. After 1:1 density-matching on local_immune_density_50um, the LTB⁺-provider deficit reduced to δ = −0.10, p = 0.14. Under multivariable OLS, is_arrested β = −0.011 (p = 0.91, not significant) on ltb_provider_neighbours_r20, with local_immune_density_50um carrying the variance (β = +0.0094, p = 1.7 × 10⁻⁴). LTB⁺-total and CD40LG⁺ neighbours were similarly not significant under OLS (p = 0.35 and 0.18 respectively). The partner deficit reduces under multivariable adjustment to “the arrested dendritic cells occupy a low-immune-density patch.”
CD40 reduction (Test 2). Per-DC CD40 expression: Cliff’s δ = −0.33 raw; −0.46 depth-adjusted (transcript depth is higher, not lower, in arrested cells: median ~1,268 versus ~1,050, so the effect is not a coverage artefact); survives density-matching at δ = −0.28, p = 5 × 10⁻⁴. Under multivariable OLS, β = −0.86, p = 1.5 × 10⁻⁵ on per-DC CD40 expression, with all density covariates p > 0.12. CD40 downregulation on tumour-retained CCR7⁺ dendritic cells is the active-rewiring signature attributed by Zitti 2026 (Immunity) to reversible Treg contact and by Lee 2024 to dwell-time exhaustion.
Transduction defect (Test 3). LTBR on the arrested dendritic cell is unchanged to slightly elevated (δ ≈ +0.08; OLS β = +0.13, p = 0.09, marginal positive; density covariates not significant). The non-canonical target programme (RELB, NFKB2, BIRC3, BAFF) drops by the largest effect of any outcome tested: target score δ = −0.79 unmatched; OLS β = −0.87, p = 3.3 × 10⁻¹⁸, with all density covariates p > 0.48. The receptor score (LTBR / CD40) drops under OLS (β = −0.34, p = 1.5 × 10⁻³), driven by the CD40 result above. The canonical-to-non-canonical ratio is the one Test-3 measure that does not survive OLS (is_arrested β = +9.3, p = 0.38) and should be read as the difference between target and receptor scores rather than as an independent quantity.
Suppressive-field localization without intrinsic suppression (Test 2 alternative). Per-DC suppression-panel score (PDCD1LG2 / CD274 / IL10 / TGFB1 / IDO1) δ = −0.71, driven mainly by IDO1 (which on LAMP3⁺ dendritic cells marks the mature pole). The local 30 µm field is checkpoint-rich (CD274 field δ = +0.39; IDO1 field δ = +0.30; whole-panel field δ = +0.30), but no Treg enrichment is detected within 30 µm (δ = −0.19). A mediation regression of the non-canonical NF-κB output reproduced the original null result: the suppressive-cytokine field within 30 µm did not predict the deficit (β = −0.0008, p = 0.44), whereas local malignant density did (β = −0.020, p = 1 × 10⁻⁶) and local immune density did in the opposite direction (β = +0.0028, p = 0.001).


3.4 Interpretation
The arrested LAMP3⁺ dendritic cells are border-localized, interferon-skewed, CD40-low cells with non-canonical NF-κB transduction failure that scales with proximity to malignant cells rather than with a measurable suppressive-cytokine field. The phenotype is a hybrid: a density-dependent partner deficit coexists with a density-independent CD40 reduction and downstream transduction failure. Separation of the two mechanisms requires multi-patient cohorts with matched density strata and protein-level CD40 / CD40L measurement. The multivariable OLS form was developed in §2.3 (dendritic-cell-side allograft-rejection test) and applied here; single-covariate matched contrasts are less conservative when, as here, the case and control groups differ on multiple density-related covariates with opposite-sign effects on the outcome.
3.5 Macrophage decomposition: the same confound at a different scale
A composite “M1 versus M2 polarization” score on the cervical macrophages (n = 9,159) produced a modest shift across tumour-density strata (Cliff’s δ ≈ 0.2–0.3). Decomposed gene by gene, 3 of 38 panel genes contribute: STAT1, MRC1, and CXCL10. The 3 genes index two distinct programmes rather than a polarization axis.
STAT1 (the interferon-γ-receptor transcription factor; a marker of recent interferon-γ exposure) was elevated in macrophages embedded in dense tumour (64% STAT1⁺ in deep-tumour stratum versus 44% in the most stromal stratum) but not in tetrad-resident macrophages, indicating that STAT1 marks bystander cells exposed to diffusing interferon-γ from active CD8 cells rather than a polarization state. MRC1 (CD206, a resident-scavenger marker) was reduced threefold in tetrad macrophages (8% MRC1⁺ versus 25% baseline), consistent with a role switch from housekeeping to antigen-presentation participation. The canonical M1 effector programme (CXCL9, IL1B, TNF, IDO1) was flat across strata despite being within Xenium’s dynamic range (CXCL9 detected in 21% of macrophages); the polarization model therefore fails on biological rather than sensitivity grounds. A composite activation score on the macrophages, as on the triad CD8 cells, reports neighbourhood density by default and must be decomposed before interpretation.

4. Position in the literature and clinical implications
4.1 Comparison with published cohorts
The closest published comparator is Syding 2025 (JITC), which applied Xenium spatial transcriptomics to cervical (CESC) and HPV⁺ HNSCC tumours and reached the same conclusion: TLS quantity did not predict survival, whereas unfavourable TLS composition did (high Treg and PMN-MDSC density, high Arg1, reduced TCRζ, exhausted/Treg-rich transcriptomes), and patients lacking HPV-specific T cells had no fully mature TLS. Syding attributes the dysfunction to suppressive-cell infiltration; the present analysis adds a dendritic-cell-side mechanism (maturation arrest at the tumour border). The two readings are compatible. Huang 2025 (Cancer Immunol Immunother) makes the analogous point from the plasma-cell side, identifying an immunosuppressive HSPA1B⁺ plasma-cell subset within cervical TLS-like niches that co-localizes with Treg and Th17 populations.
The negative triad-licensing result on this section is narrow and section-specific. The triad concept carries information in multiple published cohorts: Oh 2025 (Cell Rep Med) reports that dendritic-cell-niche organization outperformed PD-L1 for predicting pembrolizumab response in HNSCC; Lopez-Janeiro 2026 (JCI) reports cDC1-niche association with ICB benefit pan-cancer; Damle 2026 (Cancer Immunol Res) reports triads as a conserved feature of endogenous antitumour immunity. The reconciliation, consistent with the §3 findings, is that productive triads occur within mature TLS or cDC1-rich niches, a context the HPV-negative cervical section lacks.
Clinical-cohort validation of the composite readout. Oshi et al. (npj Breast Cancer 8:92, 2022; doi:10.1038/s41523-022-00466-2) provide the largest cross-cohort clinical validation of the HALLMARK_ALLOGRAFT_REJECTION composite used as the §2 readout. Across n = 6,245 breast cancer patients (METABRIC + GSE96058 + TCGA + GSE75688), the composite (scored by Gene Set Variation Analysis on the 200-gene Hallmark set) correlates strongly with cytolytic activity (Spearman r = 0.892 in METABRIC and 0.860 in GSE96058) and with anti-cancer immune-cell infiltration estimated by xCell deconvolution: CD8⁺ T cells r = 0.749 / 0.625, CD4⁺ memory T cells r = 0.824 / 0.433, M1 macrophages r = 0.711 / 0.737, pDC r = 0.839 / 0.636, NK r = 0.668 / −0.112. It also correlates with pro-cancer immune-cell infiltration (Tregs r = 0.378 / 0.152, Th2 r = 0.582 / 0.529, M2 macrophages r = 0.206 / 0.523, B cells r = 0.761 / 0.576) and with immune-checkpoint molecule expression (PDL1, PDCD1, CD274, PDCD1LG2, CTLA4, LAG3, TIGIT, BTLA, HLA-A). High score is associated with aggressive cancer biology: elevated silent and non-silent mutation rates, SNV neoantigen burden, HRD, and intratumour heterogeneity (TCGA), and with advanced Nottingham grade, AJCC stage, and lymph-node positivity (METABRIC and GSE96058).
The prognostic direction is subtype-conditional (Figure 15). In TNBC, multivariate Cox regression adjusting for age, AJCC T- and N-category, and Nottingham grade returned HRDFS = 2.18 (95% CI 1.44–3.29, p < 0.001), HRDSS = 2.12 (1.43–3.13, p < 0.001), and HROS = 1.83 (1.32–2.43, p < 0.001) for high versus low score in METABRIC; HROS p = 0.006 in GSE96058. In ER+/HER2− breast cancer the same Hallmark enrichment yielded no survival separation. Oshi et al. interpret this as TNBC reaching a sufficient absolute level of productive immune infiltration to outweigh aggressive biology while ER+/HER2− does not — the cohort-level analog of the §2.5 interpretation B framework that productive immunity must occur within the engaged compartment for outcome to follow.

Two implications for the case study. First, the composite the §2 analysis uses is the clinically validated immune-engagement readout; selecting it for the density-control tests is consistent with the established translational literature. Second, Oshi et al. (Discussion) explicitly state that the same gene-set enrichment can occur without producing the survival association, depending on tumour-context-specific productive-infiltration levels. This is the cohort-level analog of the §2 density-confounding finding and of the §2.5 interpretation B framework: composite scoring reports density of engagement, and outcome depends on whether the engagement is productive. The case study’s per-cell positivity recommendation (§2.5) and TLS-composition-based stratification (§3, §4.3) are the spatial-resolution refinements that would resolve this in spatial-transcriptomic cohorts; the Syding 2025 cervical-specific spatial finding (composition predicts survival, quantity does not) is the cervical-specific instance of the same principle.
4.2 Contributions
- HPV-stratified TLS-maturity analysis. No HPV-stratified TLS-maturity analysis is present in the literature; Su 2025 (Front Immunol) stratified cervical tumours by HPV but did not score TLS maturity. Characterizing an HPV-negative cervical immune compartment at TLS-maturation resolution (aggregate inventory, FRC-like / HEV programmes, LAMP3⁺ dendritic-cell maturation state, checkpoint-border archetype) is itself a contribution.
- Density-controlled triad test. The density-controlled triad test of §2 has not been previously applied to transcriptional readouts in any tumour type.
- Maturation-arrested LAMP3⁺ substate. The maturation-arrested LAMP3⁺ dendritic-cell substate, formally contrasted against active immunosuppression in §3, is a candidate failure mode the field has the component observations for but has not previously named.
4.3 Clinical implications, hypothesis-generating
TLS-based stratification has not been tested as an immune-checkpoint-blockade predictor in cervical cancer: neither KEYNOTE-A18 (pembrolizumab + chemoradiotherapy) nor innovaTV 301 (tisotumab vedotin) includes a lymphoid-aggregate biomarker endpoint. TLS-induction therapy (LTβR / CD40 agonists, FLT3L, IL-12 / IL-15) in invasive cervical cancer is an open area; published TLS-induction work to date is in premalignant CIN2/3 via therapeutic HPV vaccination (Zhang 2023; Germain 2015), and the closest active trial (NCT03789097: intratumoral Flt3L/CDX-301 + RT + poly-ICLC + pembrolizumab) is multi-tumour and not cervical-specific.
The maturation-arrested LAMP3⁺ dendritic-cell phenotype (intact LTβR, collapsed non-canonical NF-κB output, partner-depleted border niche, density-independent CD40 reduction) suggests a testable stratification: a CD40 agonist would bypass the downregulated receptor; FLT3L would expand the cDC compartment that the HPV-negative setting is poor in by background. Both are plausibly most active in tumours that present the triad geometry without the mature-TLS / cDC1-rich context. The hypothesis is testable in a multi-patient cohort with matched density strata.
The therapeutic rationale is strongest under interpretation B-intratumoral (§2.5): if the licensing bottleneck is in the tumour itself, fixing the dendritic-cell-side maturation arrest there is the proximate cause and the proximate intervention point. The rationale is weaker under interpretation B-LN: if the licensing bottleneck is in the tumour-draining lymph node, the intratumoral arrested LAMP3⁺ pole is a downstream symptom of a different upstream block, and a CD40 agonist on intratumoral DCs would be less directly indicated. Resolving B-intratumoral versus B-LN is a prerequisite for clinical translation of this specific stratification and requires the paired tumour / lymph-node TCR clonality and lineage-tracing evidence noted in §2.5.
4.4 Limitations
All findings derive from a single FFPE section, and the literature reviews do not change that. Cross-cohort generalization of any specific claim, including the density-controlled negative result on triad licensing, requires multi-patient validation. The transferable element of this case study is the methodological recommendation rather than the specific section-level outcome.
The §2 multivariable density adjustment is robust on the CD8 and CD4 lineages but is sensitive on the dendritic-cell lineage to whether local_malignant_density_30um is included as a covariate (full sensitivity table in §2.3.1). Without that covariate the dendritic-cell-side residual is Cliff’s δ = +0.23 (small-to-medium), interpretable as dendritic-cell state varying at the tumour-immune interface rather than as licensing; with it the residual is δ = +0.04 (negligible). The licensing claim — which rests on the CD8-side analyses in §2.1 and §2.2 — is unaffected by this choice. The covariate set tested here does not exhaust all possible confounders: counts and area covariates were included, cell-segmentation-quality covariates and probe-level sensitivity covariates were not. The §3 discriminating tests use the full covariate set and inherit the same limitation. Protein-level CD40 / CD40L validation by multiplex immunofluorescence or imaging mass cytometry on a sister section would strengthen the §3 CD40-reduction conclusion.
The 20 µm triad-anchor radius is the Espinosa-Carrasco published definition and is geometric rather than biochemical; direct cell-cell receptor engagement requires sub-micrometre contact, which the spatial resolution of Atera WTA Preview does not adjudicate. A sensitivity analysis at 10 µm would tighten this; the present analysis uses 20 µm for consistency with the source publication.
The §2.5 per-cell-positivity finding rules out a strict null reading (no productive immunity anywhere relevant to this section) but does not locate the licensing event. The same proliferating-CD8 enrichment in immune-dense regions and high-TLS-score aggregates is consistent with intratumoral past-triad licensing (B-intratumoral) and with lymph-node licensing followed by selective tumour homing (B-LN); the data on this section cannot distinguish them. Section-level observations weakly favour B-intratumoral (the mature-TLS aggregate fraction, the mature pole of the LAMP3⁺ migratory dendritic-cell partition, the arrested-LAMP3⁺ pole at the tumour border, and the original report’s positive-NES proliferation modules in triad versus would-be-triad CD8s) but no single observation is decisive. Definitive adjudication requires paired tumour / tumour-draining-lymph-node TCR clonality, in-situ lineage tracing, or paired-biopsy multi-patient cohorts with temporal staging.
Methods summary
Single 10x Atera WTA Preview FFPE cervical squamous cell carcinoma section; ~18,000 gene symbols; MiraTyper --panel all --run-malignant, tissue prior UBERON:0000995 α 1/10; MiraTyper proprietary gene-embedding model (98.7% panel coverage). All effect sizes are Cliff’s δ (rank-biserial); |δ| < 0.15 negligible, 0.15–0.33 small, 0.33–0.47 medium, > 0.47 large. p-values are inflated at large n and are reported alongside δ throughout.
Ready to Classify Your Cells?
See how MiraTyper can deliver accurate, reproducible cell type and malignancy annotations on your spatial-transcriptomics datasets.