
Density, not Triad Geometry, drives Allograft Rejection Signature in Reference Cervical Cancer Atera Slide
A density-controlled spatial-transcriptomics case study. MiraTyper cell-type and malignancy inference on a single 10x Atera WTA FFPE section — reproducing the triad geometry, then showing that the canonical activation signature does not survive density adjustment.
Summary
Immune triads — a CD8⁺ cytotoxic T cell, a CD4⁺ helper T cell, and a dendritic cell co-localized within 20 µm — have been proposed as the in situ spatial signature of productive T-cell licensing, the antigen-presentation handshake that activates CD8 cells for effector function (Espinosa-Carrasco et al., Cancer Cell 2024). To test whether this geometric motif marks productive licensing in HPV-negative cervical carcinoma, we analysed a single 10x Atera WTA FFPE section (717,576 cells, 18,028 gene symbols). The section reproduced the predicted geometry: 406 triad-anchor CD8 cells (23.8% of CD8) concentrated along the invasive margin, and the in-triad versus out-of-triad transcriptional contrast enriched the canonical T-cell-activation programmes — allograft rejection, interferon-γ response, IL-6 / JAK / STAT3, and a CXCL9→CXCR3 axis matching dendritic-cell chemokines to CD8 receptors — consistent with the licensing readout reported in recent triad-adopting cohorts.
The lead readout we use throughout is the HALLMARK_ALLOGRAFT_REJECTION composite — a 200-gene MSigDB Hallmark set that has been cross-cohort validated (n = 6,245 breast cancer patients; Oshi et al., npj Breast Cancer 2022) as the strongest single-pathway proxy for productive anti-tumour immune activity, correlating with cytolytic activity, CD8⁺ infiltration, and improved survival in triple-negative disease. On this section it is elevated both at triad anchors and in dense immune neighbourhoods, alongside the interferon-γ response and inflammatory response programmes — the expected qualitative pattern that motivates the density-confounding tests in §3.
Composite activation scores in spatial transcriptomics rise with local cell density irrespective of mechanism, a confound recurrent in spatial-statistics analyses. To distinguish a triad-specific licensing signal from this density floor, we applied two controls. First, a “would-be-triad” comparator (CD8 cells with a CD4 neighbour but no dendritic-cell neighbour within 20 µm) — under the licensing hypothesis these should not score like triads, because the dendritic cell is the licensing source. Contrary to this prediction, they scored indistinguishably from genuine triads (Cliff’s δ = 0.09, a rank-based effect size where |δ| < 0.15 is negligible). Second, multivariable regression of each per-cell score against local cell, immune, and malignant density, and re-testing the contrast in the residuals. After this adjustment, the apparent dendritic-cell-side activation on HALLMARK_ALLOGRAFT_REJECTION collapsed from Cliff’s δ = +0.410 (n = 680 vs 26,908) to β = +0.004, p = 0.18, indicating that the unadjusted contrast reports neighbourhood density rather than triad geometry.
The companion tertiary-lymphoid-structure analysis identified a candidate dendritic-cell-side mechanism. Of 138 B/T-cell aggregates on the section, 11.6% met mature-TLS criteria. The LAMP3⁺ migratory-dendritic-cell compartment — LAMP3 marks the mature, antigen-presenting state of these cells — partitioned into a mature pole in the stromal interior and an arrested pole at the tumour border (median 7.6 vs 17.1 µm to the nearest malignant cell, about half the distance) with reduced CCR7 / CD83 maturation markers, an interferon-stimulated-gene-skewed transcriptome, density-independent reduction of the costimulatory receptor CD40 (β = −0.86, p = 1.5 × 10⁻⁵), and collapsed non-canonical NF-κB target output — the transcriptional programme that LTβR engagement normally drives during DC maturation (RELB / NFKB2 / BIRC3 / BAFF target score β = −0.87, p = 3.3 × 10⁻¹⁸) — despite intact upstream LTβR expression, suggesting that the receptor is present but downstream transduction is broken. The defect tracked proximity to malignant cells (β = −0.020, p = 1 × 10⁻⁶) rather than a measurable suppressive-cytokine field (β = −0.0008, p = 0.44), consistent with a contact- or short-range factor at the tumour interface as the proximate cause.
Together these findings suggest a testable therapeutic stratification for HPV-negative cervical tumours that present triad geometry without dendritic-cell maturation: a CD40 agonist to bypass the downregulated receptor, paired with FLT3L to expand the conventional dendritic-cell compartment that the HPV-negative setting is depleted in. Because all findings derive from a single FFPE section, multi-patient validation with matched density strata and protein-level CD40 / CD40L measurement would be required before this stratification can be evaluated.
The transferable methodological observation is that composite activation scores in spatial-omics data report local neighbourhood density by default; multivariable density adjustment, dendritic-cell-subtype resolution, and a density-matched negative control are required before any cell-cell-signalling claim.
Companion technical report. Full methods, complete numerical results, supplementary figures, OLS tables, and literature cross-references are in the technical report.
1. Specimen and pipeline
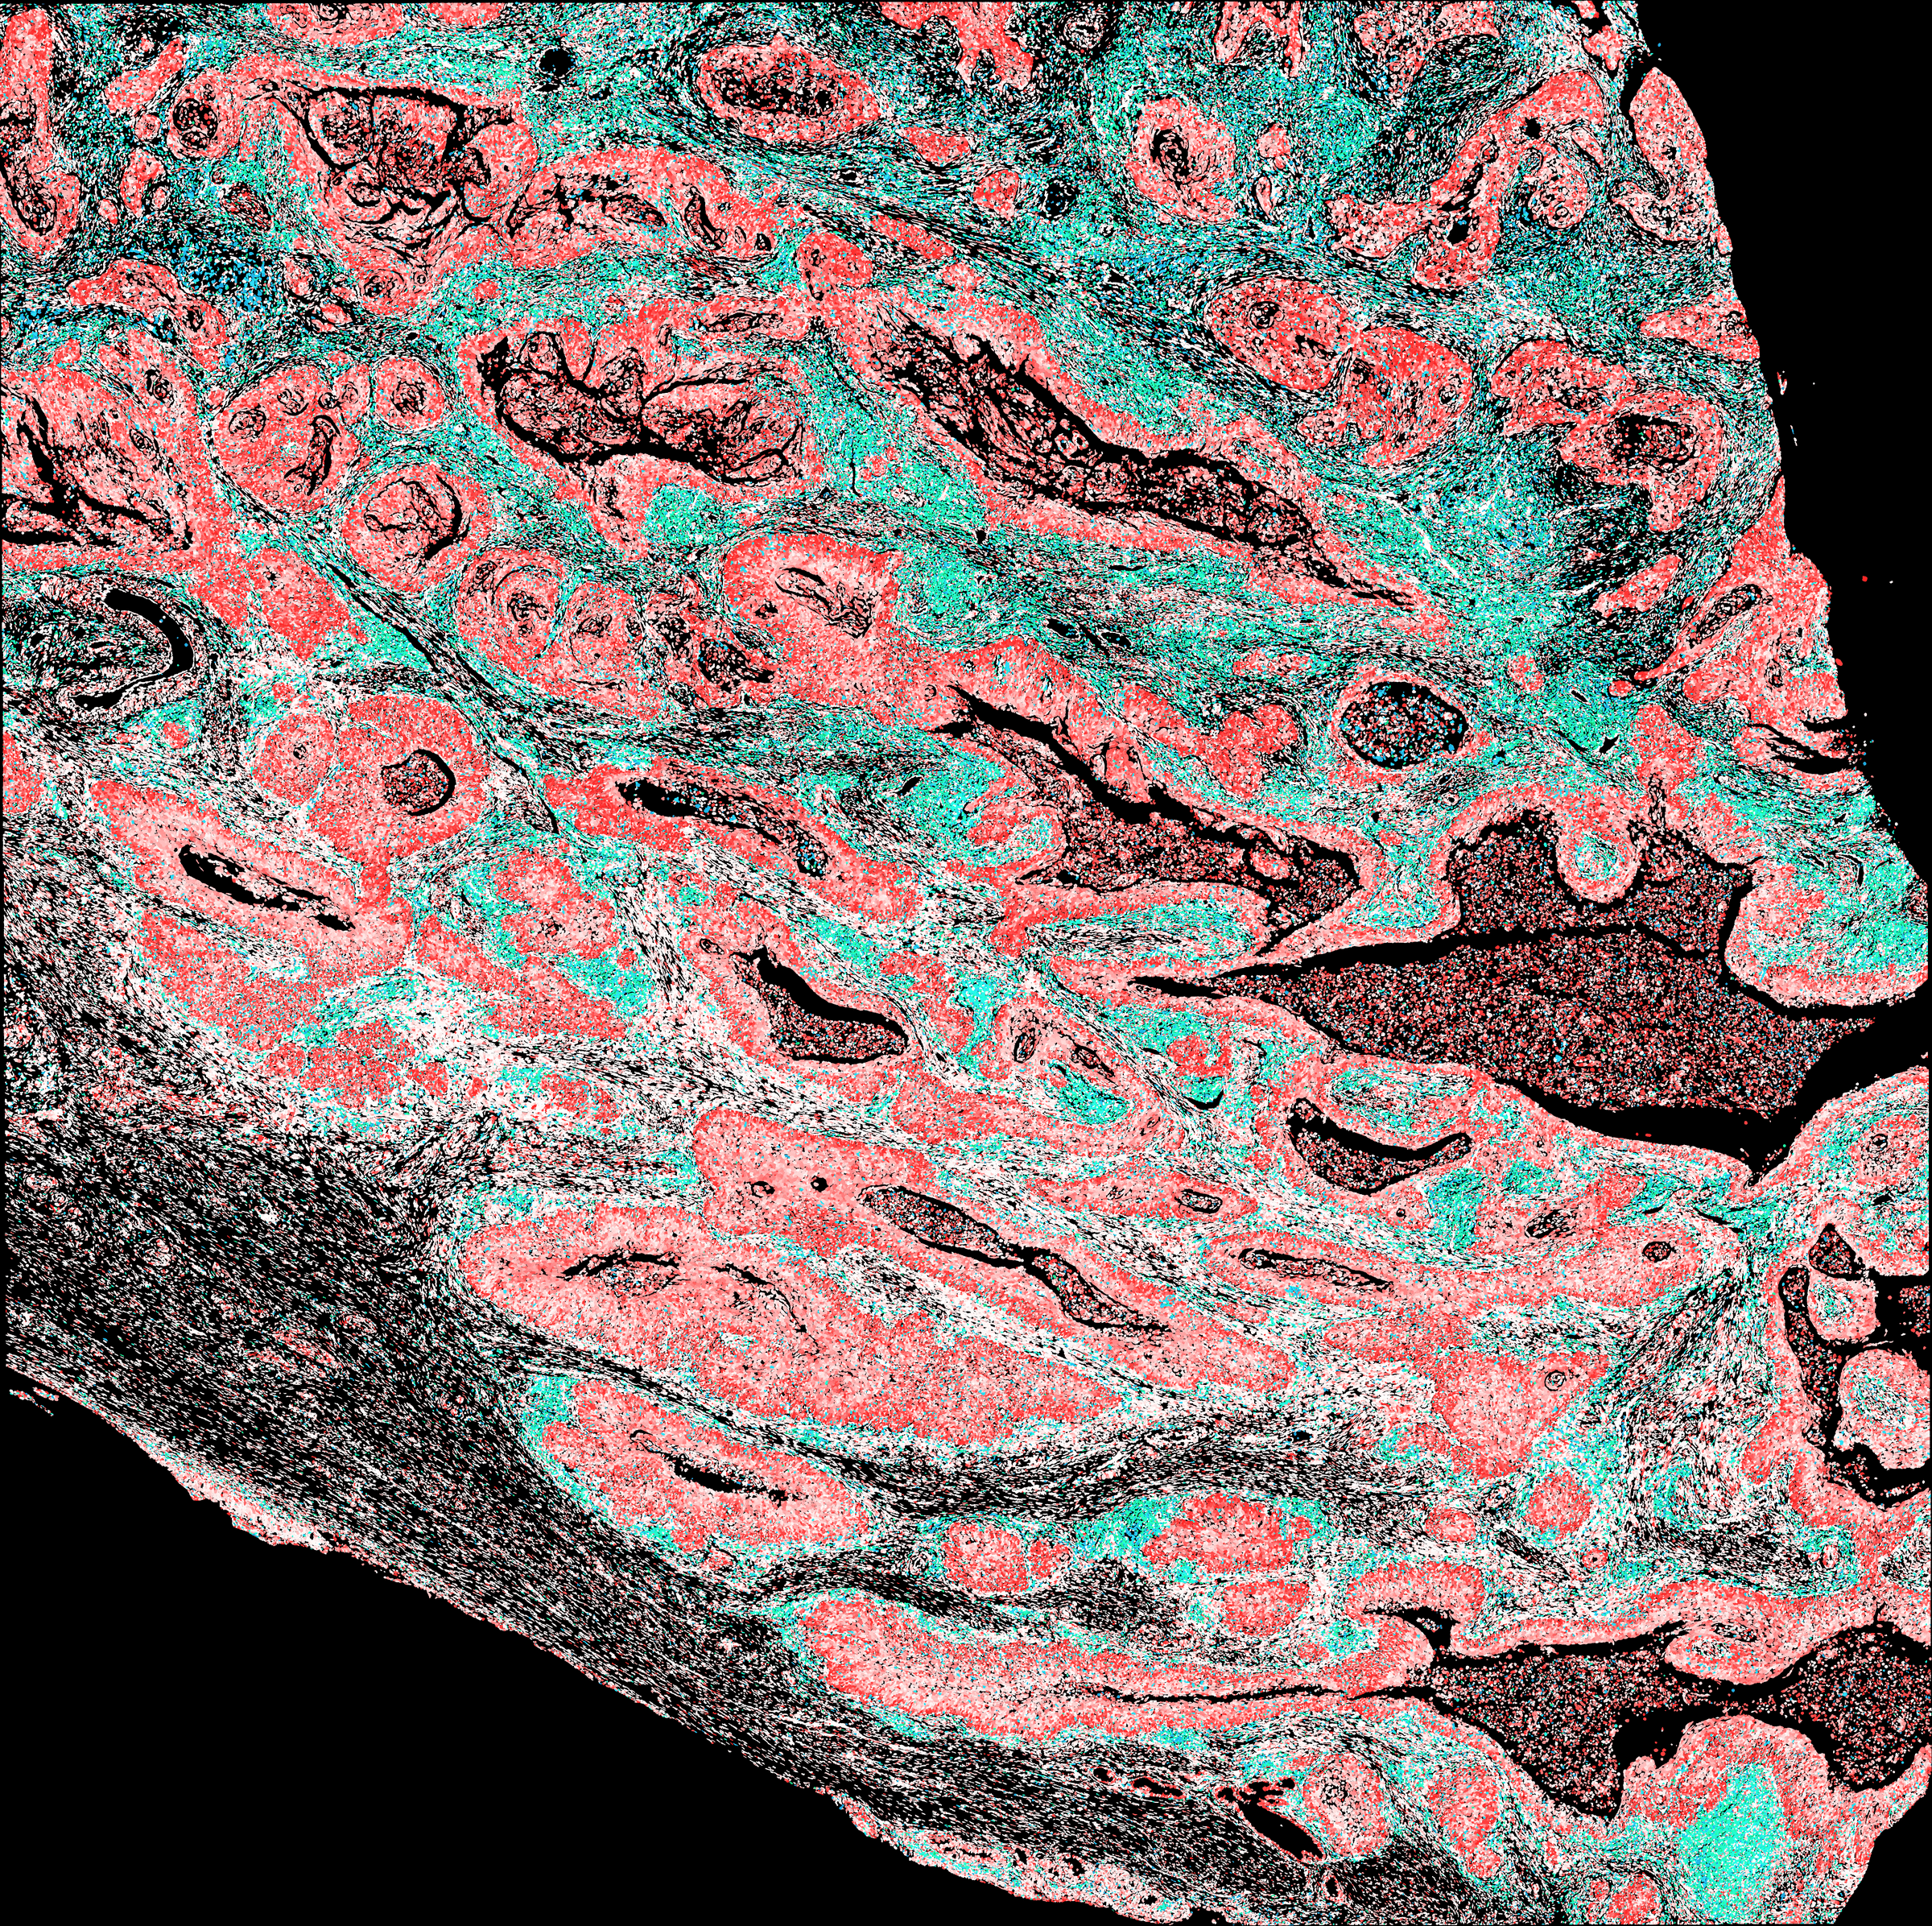
A 10x Atera WTA Preview FFPE cervical squamous cell carcinoma section (717,576 cells; 18,028 gene symbols) was processed through the MiraTyper pipeline for cell-type and malignancy classification (miratyper --panel all --run-malignant --tissue-id UBERON:0000995 --tissue-prior-alpha 1 10; MiraTyper proprietary gene-embedding model, 98.7% panel coverage). 25.9% of cells were classified as malignant epithelium and 22.0% (157,650 cells) as immune.
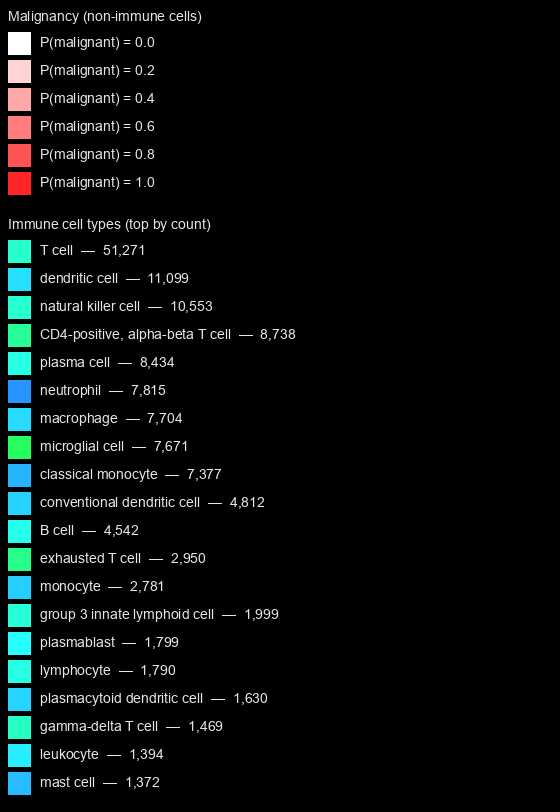
The whole-section rendering above (Figure 1) encodes identity at constant brightness: non-immune cells are coloured red with saturation scaled by p_malignant, and immune cells are placed on a green-to-blue hue ramp by metric multidimensional scaling on cell-ontology shortest-path distance.
2. Productive-triad signature, baseline analysis
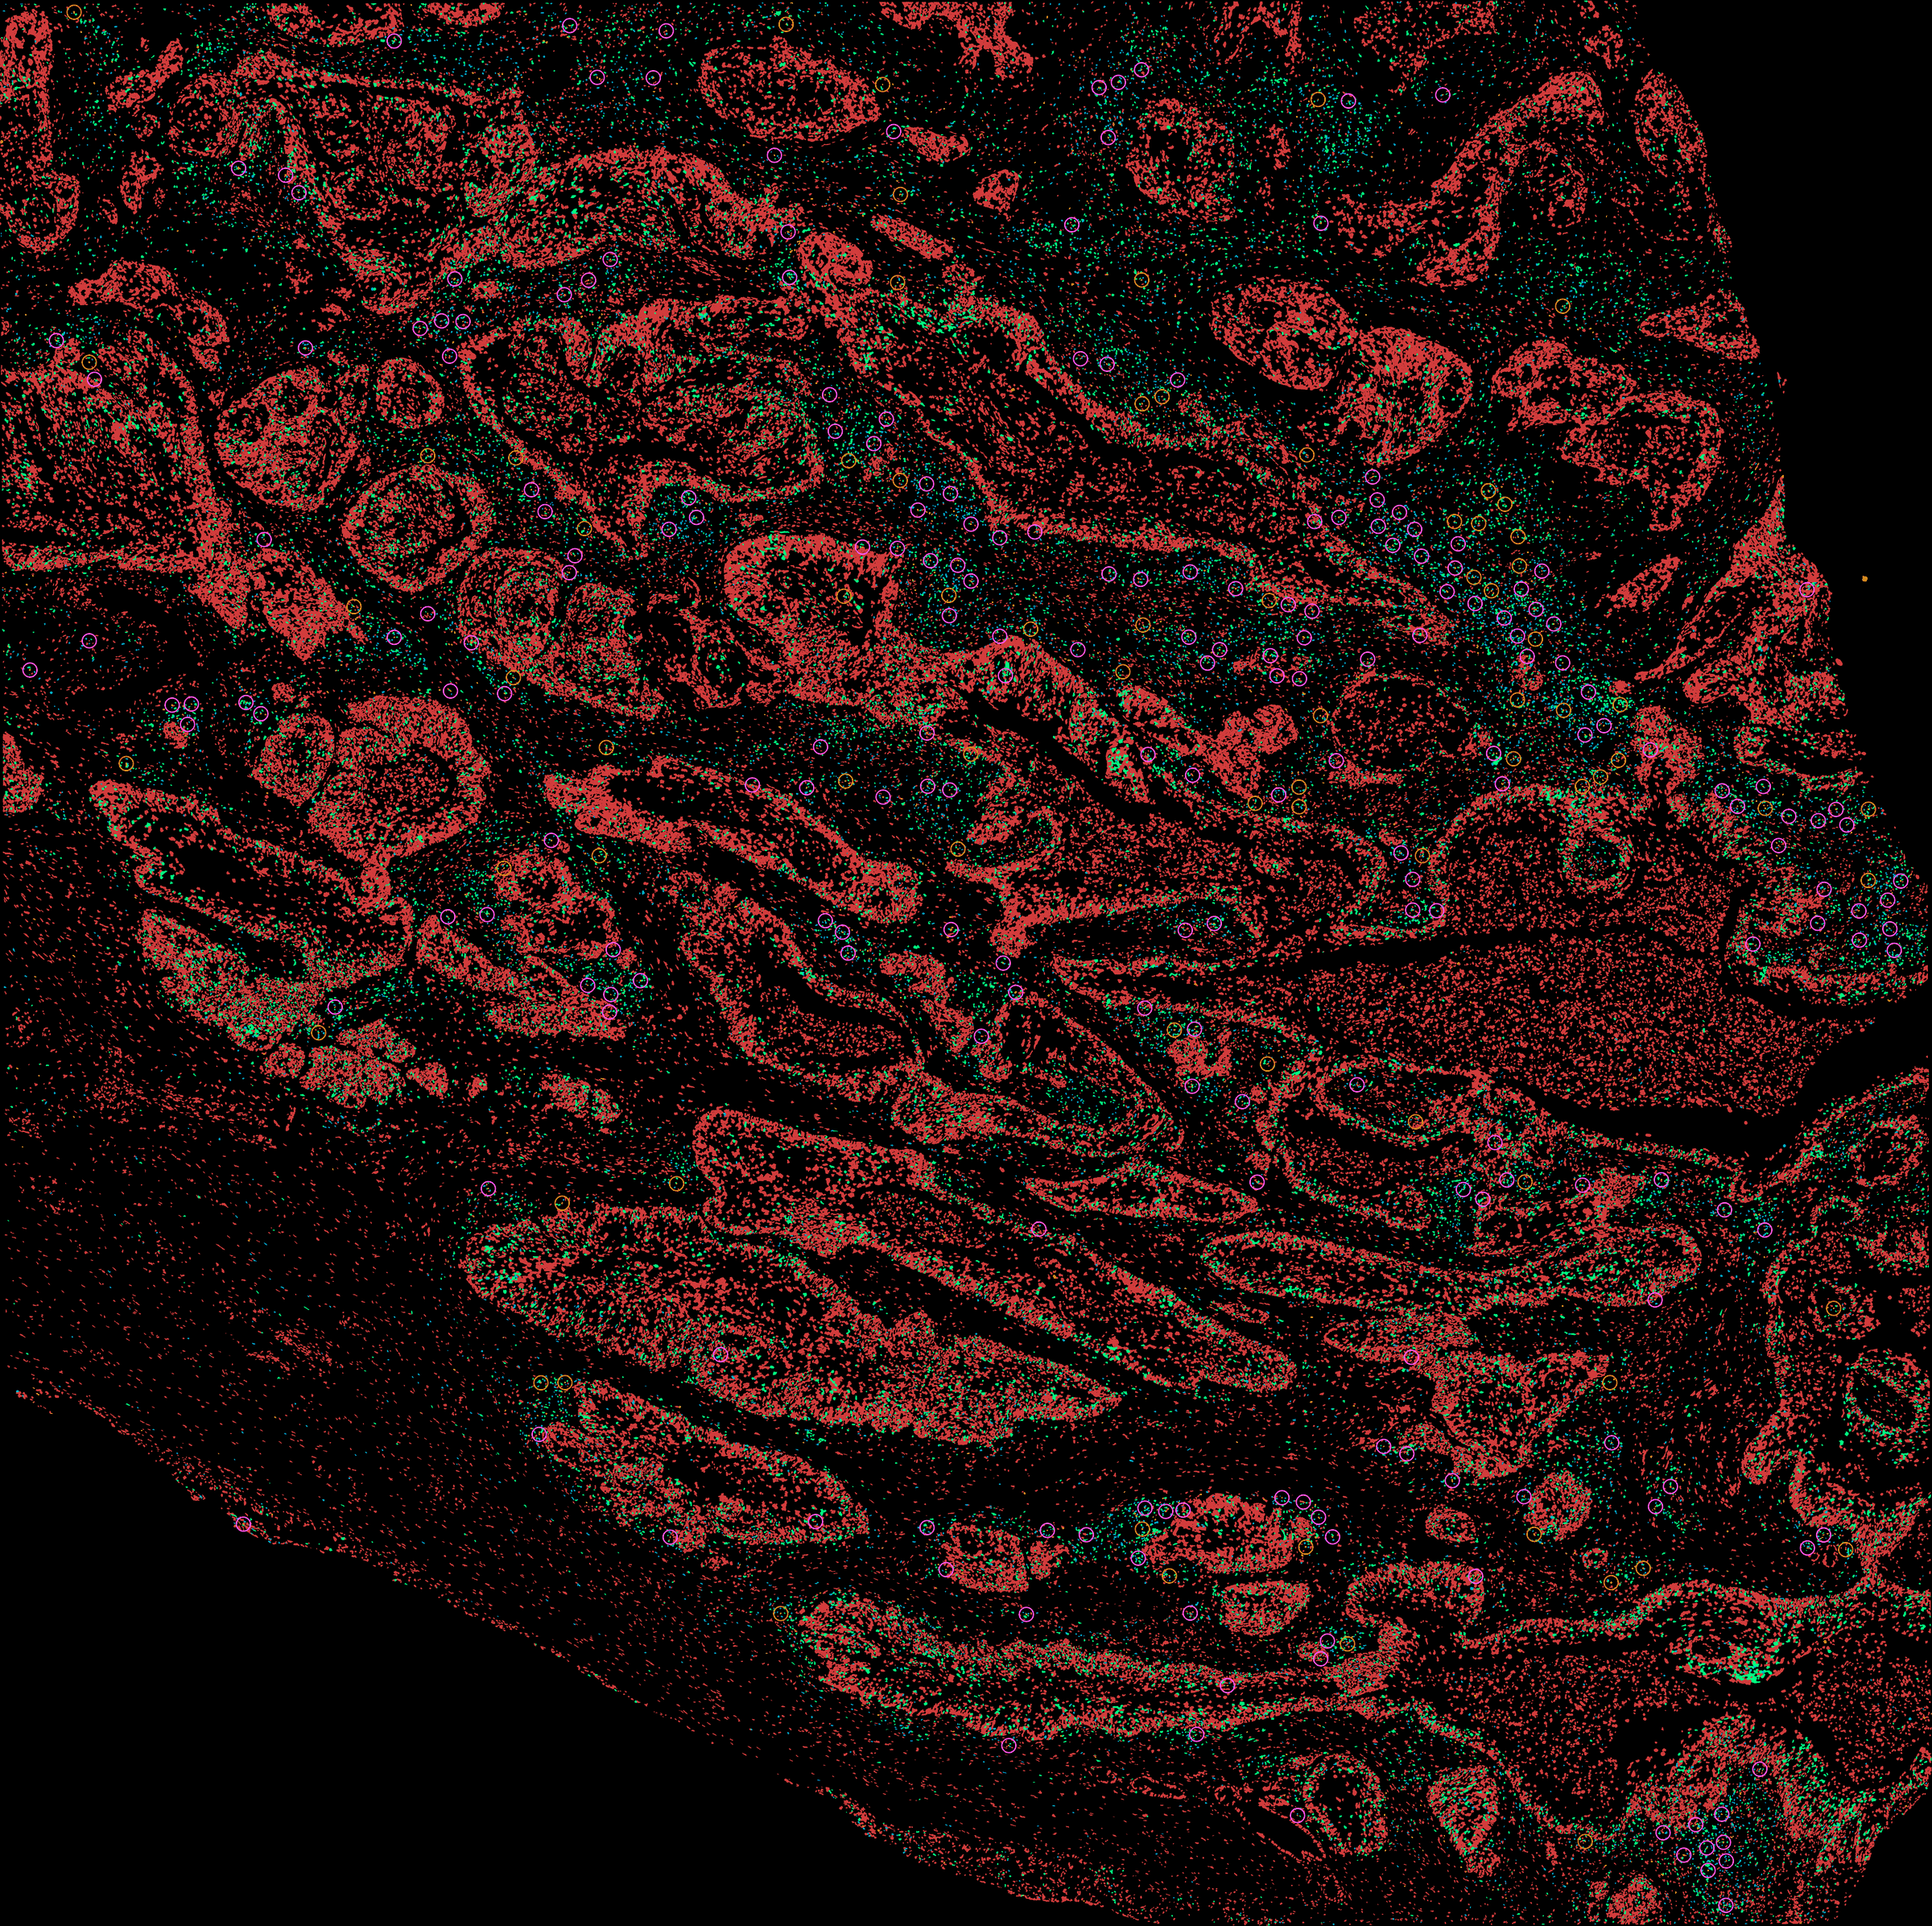
A triad anchor is a CD8⁺ T cell with at least one CD4⁺ T cell and one dendritic cell within 20 µm — the spatial signature predicted to mark sites of productive licensing (Espinosa-Carrasco et al., Cancer Cell 2024). With cell identity resolved by Cell-Ontology descent, 406 of 1,703 CD8 cells (23.8%) satisfied the triad criterion (275 retained after 80 µm greedy thinning for display). Triads were enriched for the licensing-competent dendritic-cell subtypes: conventional dendritic cells (cDCs) rose from 26% to 42% of the dendritic-cell pool inside triads, and plasmacytoid dendritic cells from 8.5% to 19.5%. Cytotoxic and memory CD8 cells were the most triad-engaged CD8 subsets, consistent with their role as the licensing-competent effector pool. The triads themselves concentrated along the invasive margin between malignant epithelial lobules and immune-infiltrated stroma.

To test whether the triads carry the expected transcriptional signature of productive licensing, we contrasted in-triad versus out-of-triad cells on each of the three triad lineages by whole-transcriptome differential expression, followed by gene-set enrichment against the MSigDB Hallmark and Reactome collections of co-regulated programmes. The CD8 cells inside triads showed coordinated enrichment of the classical T-cell-activation programmes — allograft rejection, interferon-γ response, IL-6 / JAK / STAT3, and inflammatory response — together with an enriched chemokine-receptor axis whose receptors match the chemokines upregulated on the dendritic-cell side (most notably the CXCL9→CXCR3 axis that draws effector CD8 cells toward dendritic-cell-presented antigen). The CD4 cells showed recruitment and costimulation programmes; the dendritic cells showed a mature-migratory phenotype. This three-lineage pattern reproduces the licensing readout reported in recent triad-adopting cohorts (Damle 2026; Lopez-Janeiro 2026; Oh 2025), and on its own would support the licensing-handshake interpretation. Full enrichment statistics, the ligand-receptor concordance table, and per-lineage volcano plots are in the technical report §1.3.
3. Density-adjusted analysis: the licensing signal does not survive
The unadjusted in-triad-versus-out-of-triad contrast pools genuinely isolated T cells together with T cells embedded in dense lymphoid aggregates that happen to lack a dendritic cell. Because composite Hallmark scores rise in dense immune neighbourhoods irrespective of mechanism — a confounder recurrently documented in spatial-statistics analyses — the relevant question is whether the triad signal is specific to triad geometry, or generic to immune density. To separate the two, we applied two complementary controls.
First, a would-be-triad comparator: CD8 cells with a CD4 neighbour but no dendritic-cell neighbour within 20 µm. Under the licensing hypothesis, these T cells should not score like genuine triads, because the dendritic cell is the licensing source — the antigen-presenting partner is missing. Contrary to this prediction, the would-be-triad CD8 cells scored indistinguishably from genuine triad anchors; CD8 cells with a dendritic-cell neighbour but no CD4 partner did so as well, with the residual triad-versus-would-be-triad gap (Cliff’s δ = 0.09) statistically detectable but biologically negligible. Geometry alone, without the costimulatory cell type, recovers the same per-cell activation profile.
Second, a multivariable density adjustment: for each triad lineage we regressed the per-cell Hallmark activation score against local cell density, immune density, malignant density, sequencing depth, and cell area, and re-tested the in-triad-vs-out-of-triad contrast in the residuals — the variance not already explained by density. If triad geometry adds anything beyond density, the contrast should survive density adjustment. The unadjusted dendritic-cell-side contrast was the largest of the three (Cliff’s δ = +0.41; CD4-side +0.11, CD8-side +0.09); after adjustment, however, all three collapsed to negligible effect size (residualized δ = +0.04 / +0.05 / −0.04 for DC / CD4 / CD8; Figure 4), inconsistent with a triad-geometry-specific signal.

A third independent control, detailed in the technical report, points the same direction: a cDC1-resolved, density-matched Hallmark GSEA. cDC1 cells are the dendritic-cell subtype that cross-presents tumour antigen to CD8 cells, so proximity to a cDC1 specifically — rather than to any dendritic cell — would be expected to produce a residual licensing signal even when the broad triad signal is density-confounded. Instead, every productive-immunity Hallmark programme returned negative enrichment under that test (technical report §2.2), pointing in the opposite direction.
Together, the three controls indicate that the apparent licensing signature at current 20 µm triad anchors on this section is fully explained by local immune density rather than by triad geometry. The CD8-side controls, which carry the licensing claim, are robust; the dendritic-cell residual is partially sensitive to whether malignant-cell density is included as a covariate, but does not alter that conclusion (sensitivity analysis: technical report §2.3.1). A literature review identified no prior application of density controls of this kind to triad-anchor transcriptional readouts, suggesting that previously reported triad licensing signatures may carry a similar confound.
4. Productive immunity in immune-dense regions and high-TLS aggregates
The §3 controls indicate that the composite Hallmark signal at current 20 µm triad anchors is fully explained by neighbourhood density. They do not, however, address a distinct question: whether productive immunity has occurred somewhere and the licensed effector cells are now present on the section, regardless of where the licensing event itself took place. To address this, we asked whether cell-intrinsic markers of effector function and proliferation — gene products expressed by an individual CD8 cell only after antigen engagement, and therefore independent of who its current neighbours are — are spatially structured.
Two readings are compatible with the §3 result. (A) Null reading: no productive licensing has occurred anywhere relevant to this section, and the composite-Hallmark elevation is a density artefact end to end. (B) Active-immunity reading: productive licensing has occurred and the licensed CD8⁺ T cells are present on the section, concentrated in the dense immune compartment (Figure 5). Within (B), the location of the licensing event admits two sub-readings that a single FFPE section cannot distinguish: (B-intratumoral) licensing happened on this section, at past triads or now-dissolved seeding events, and the productive niche is now self-sustained; (B-LN) licensing happened in the tumour-draining lymph node and the licensed CD8s circulated back and homed to the dense compartment of the tumour. Under (A) the cell-intrinsic markers should be flat across the section; under (B) they should be elevated in immune-dense regions and inside high-TLS aggregates, where the licensed CD8s would be concentrated (Figure 6).

We used two conventional marker sets as proxies for licensed-and-active CD8 cells: proliferation markers (MKI67, TOP2A, PCNA, TYMS, MCM6) for cells in cell cycle — the strongest single signal of antigen-engaged clonal expansion — and effector-cytotoxicity markers (IFNG, GZMA, GZMB, PRF1, NKG7) for cells actively secreting effector molecules. Per-cell binary positivity is used in place of Tirosh-style composite scores because composite scores on sparsely detected functional markers are dominated by their density-tracking random-control baseline (technical report §2.5).

About one in eight CD8 cells on the section was in cell cycle, and about one in four was effector-positive — both substantial fractions for an HPV-negative tumour. Crucially, these populations were spatially structured rather than uniform: the proliferating-CD8 rate was about 2.5× higher in dense immune neighbourhoods than in sparse ones, and about 1.5× higher inside high-TLS aggregates than outside, consistent with active clonal expansion of licensed CD8s in those niches. The effector-positive rate showed a weaker density gradient and no aggregate-context effect.
Together this pattern rules out the strict null reading (A): CD8 cells in cell cycle have been licensed somewhere, and they are not distributed uniformly. The pattern does not, however, locate the licensing event — the same per-cell enrichment is consistent with both B-intratumoral and B-LN, and a single FFPE section without TCR clonality data, lineage tracing, or paired tumour / lymph-node biopsies cannot distinguish the two sub-readings. Several section-level observations weakly favour B-intratumoral — the in-situ mature-TLS aggregates and the licensing-competent mature LAMP3⁺ dendritic-cell pole inside the tumour (§5), plus a directionally consistent proliferation signal in the original triad-versus-would-be-triad CD8 contrast — but no one observation is decisive (technical report §2.5).
5. Maturation-arrested LAMP3⁺ dendritic cells at the malignant border
If triad geometry forms but licensing does not follow, the dendritic-cell side of the handshake is one place to look: dendritic cells that arrive in T-cell company but fail to complete maturation cannot deliver the costimulatory signal that licenses CD8 cells. LAMP3 (DC-LAMP) is a hallmark marker of mature migratory dendritic cells, coincident with CCR7-driven migration from tumour to draining lymph node; reduced LAMP3-compartment maturation has been reported in tumour-retained CCR7⁺ DCs in pancreatic and lung cancers, and attributed to Treg-mediated rewiring and dwell-time exhaustion (Zitti 2026; Lee 2024). We observed something similar here (Figure 7): on this section, the LAMP3⁺ migratory compartment splits in two by distance to the malignant front — a fully mature pole in the stromal interior, and a CD40-low, transduction-broken pole at the tumour border.

5.1 Aggregate composition
Mature tertiary lymphoid structures (TLS) are tumour-adjacent lymphoid aggregates that recapitulate lymph-node architecture — a germinal centre with B-cell clonal expansion, separated B and T cell zones, and resident LAMP3⁺ dendritic cells — and their presence has been associated with improved immune-checkpoint-blockade response across cancer types. On this section, we identified 138 B/T-cell aggregates; about 12% met all three mature-TLS criteria (germinal-centre programme, LAMP3⁺ dendritic-cell presence, and B/T zonation). That fraction falls within the published cervical range and at its immature end — consistent with the section’s HPV-negative status, in which TLS maturation is typically lower than in HPV-positive disease (Gorvel 2025; Su 2025). The remaining ~88% of aggregates are immune-rich but lack the germinal-centre architecture (Figure 8).

5.2 LAMP3⁺ dendritic-cell partition
Re-clustering the LAMP3⁺ migratory compartment (~1,000 cells gated by a small migratory-marker signature) and projecting each subcluster back onto the section, we identified two clear spatial poles (Figure 9): a mature pole in the stromal interior (median 17.1 µm to the nearest malignant cell), with normal CCR7/CD83 maturation markers and intact non-canonical NF-κB target output — the licensing-competent state; and an arrested pole at the tumour-immune interface (median 7.6 µm, about half the distance), with reduced maturation markers, an interferon-stimulated-gene (ISG)-skewed transcriptome consistent with chronic interferon exposure in the tumour bed, and collapsed non-canonical NF-κB output despite intact LTβR expression.

5.3 What is driving the arrest
To distinguish among the candidate drivers of the arrest, we tested three mechanisms side by side on the arrested-versus-mature contrast under the same multivariable density adjustment used in §3. The candidates correspond to three distinct sites of failure: the local niche (partner cells missing), the dendritic-cell surface (the upstream receptor down), and the dendritic-cell interior (transduction broken downstream of the receptor).
The first — a licensing-partner deficit — reduces under adjustment to a description of the patch the arrested cells happen to occupy: they sit where there are fewer B cells, CD4 T cells, and fibroblasts to provide the LTβ and CD40L ligands that engage LTβR and CD40 on the dendritic cell to drive non-canonical NF-κB activation. The deficit is real but it is not statistically separable from the low local immune density of that patch, suggesting that on this section the partner depletion is a feature of the neighbourhood rather than an independent driver.
The second — CD40 reduction on the dendritic cell itself — survives density adjustment cleanly. The arrested pole shows substantially lower per-cell CD40 expression than the mature pole independent of any local-density effect, indicating that the dendritic cell has down-tuned the costimulatory receptor that helper T cells need to engage. Reduced CD40 on tumour-retained CCR7⁺ dendritic cells has previously been reported and attributed to Treg-mediated rewiring and dwell-time exhaustion (Zitti 2026; Lee 2024).
The third — downstream transduction failure — is the largest effect. The non-canonical NF-κB target programme (RELB / NFKB2 / BIRC3 / BAFF; the transcription factors and target genes that execute the final stage of dendritic-cell maturation) is dramatically reduced in arrested cells under full adjustment, even though the upstream LTβR receptor is intact, suggesting that the dendritic cells receive the maturation signal at the surface but fail to relay it to the nucleus. The transduction failure tracks proximity to malignant cells rather than a measurable suppressive-cytokine field in the local neighbourhood — the field is checkpoint-rich, but the arrested dendritic cells themselves are not intrinsically suppressive, consistent with a contact-mediated or short-range factor at the tumour interface as the proximate cause.
Taken together, the arrested LAMP3⁺ pole is a hybrid phenotype: a density-explained partner deficit coexisting with a density-independent CD40 reduction and a downstream transduction failure that tracks tumour proximity. Separating the two density-independent mechanisms cleanly would require multi-patient cohorts with matched density strata and protein-level CD40 / CD40L measurement (technical report §3.3).
6. Discussion
Triad geometry as a spatial landmark, not a biomarker of productive immunity
Geometry is necessary but not sufficient: triads form without producing the licensing handshake. The closest published comparator (Syding 2025; Xenium on cervical and HPV⁺ HNSCC) reached the same conclusion from the suppressive-cell side: TLS quantity did not predict survival, but unfavourable TLS composition (high Treg / PMN-MDSC, high Arg1, reduced TCRζ) did. Cell-cell-signalling claims from spatial-omics data should be reported with multivariable density adjustment, dendritic-cell-subtype resolution, and a density-matched negative control.
Therapeutic implications
TLS-based stratification has not been tested as an immune-checkpoint-blockade predictor in cervical cancer (no lymphoid-aggregate endpoint in KEYNOTE-A18 or innovaTV 301), and TLS-induction therapy in invasive cervical disease is an open area — published TLS-induction work to date is in premalignant CIN2/3 via therapeutic HPV vaccination. The maturation-arrested LAMP3⁺ dendritic-cell phenotype identified here suggests a stratification that addresses each layer of the defect: a CD40 agonist to bypass the downregulated costimulatory receptor, paired with FLT3L to expand the cDC compartment that the HPV-negative setting is depleted in by background. The rationale is strongest under §4 interpretation B-intratumoral, where the licensing bottleneck is in the tumour and the arrested LAMP3⁺ pole is the proximate cause; it is weaker under B-LN, where the bottleneck is in the lymph node and the arrested-DC pole is downstream. Distinguishing B-intratumoral from B-LN with paired tumour / lymph-node TCR clonality and lineage tracing is a prerequisite for translation of this stratification.
Clinical context for the allograft-rejection readout
The composite used as the density-control proxy in §3 has been cross-cohort validated as the strongest single-pathway Hallmark proxy for anti-tumour immune activity in breast cancer (Oshi et al., npj Breast Cancer 2022; n = 6,245 across METABRIC, GSE96058, TCGA, GSE75688). It tracks cytolytic activity and broad immune-cell infiltration, but also tracks aggressive cancer biology and pro-cancer infiltration (Tregs, M2 macrophages). Like the spatial readout here, the bulk-cohort version of this composite reports immune-compartment engagement, not productivity-specific anti-tumour immunity.
The prognostic direction is subtype-conditional (Figure 10). In TNBC, a high allograft-rejection score is associated with significantly better disease-free, disease-specific, and overall survival under multivariate Cox adjustment. In ER+/HER2− breast cancer the same gene-set enrichment yields no survival separation despite the same enrichment magnitude, which Oshi et al. interpret as TNBC reaching a sufficient absolute level of productive infiltration to outweigh aggressive biology while ER+/HER2− does not — the cohort-level analog of the case study’s finding that productive immunity must occur within the engaged compartment for outcome to follow.

HPV-negative cervical SCC has not been analysed in this framework. The closest cervical-specific spatial comparator (Syding 2025, Xenium on cervical and HPV⁺ HNSCC) independently concludes that TLS composition — not quantity — determines outcome. The case study’s per-cell-positivity refinement (§4) is the spatial-resolution analog of the same principle: bulk-cohort or composite-Hallmark scoring cannot separate density-driven engagement from per-cell productive immunity. Multivariable density adjustment for cell-cell-signalling claims and per-cell positivity for sparse functional markers would resolve that ambiguity prospectively in spatial-transcriptomic cohorts. Full cross-cohort correlations, hazard ratios, and discussion are in Oshi et al. and in the technical report §4.1.
Limitations
Our study has several limitations. First, all findings derive from a single FFPE section, so the negative result on current 20 µm triads is necessarily narrow and section-specific; it reconciles with the published positive cohorts under the hypothesis that productive triads occur within mature TLS or cDC1-rich niches, a context the HPV-negative cervical section lacks. Second, the §4 active-immunity reading rules out a strict null but does not locate the licensing event — the proliferating-CD8 enrichment pattern is consistent with both intratumoral past-triad licensing and lymph-node licensing followed by selective tumour homing, and a single FFPE section cannot distinguish the two without paired TCR clonality, lineage tracing, or temporal data. The transferable element of this case study is therefore the methodological recommendation, not the section-specific negative outcome.
7. Conclusions
Triad Geometry Is Reproduced on a Single Section
- 406 triad-anchor CD8 cells (23.8% of CD8) concentrate along the invasive margin, with conventional and plasmacytoid dendritic cells enriched within triads
- The unadjusted in-triad versus out-of-triad contrast recovers the canonical activation signature: allograft rejection, interferon-γ response, IL-6 / JAK / STAT3, and a CXCL9→CXCR3 chemokine axis
The Licensing Signal Does Not Survive Density Adjustment
- Would-be-triad CD8 cells (CD4⁺, DC⁻) score indistinguishably from genuine triads (δ = 0.09)
- cDC1-resolved, density-matched GSEA returns negative NES on every productive-immunity programme
- Multivariable OLS adjusting for local density eliminates the dendritic-cell-side allograft-rejection effect (β = +0.004, p = 0.18)
A Maturation-Arrested LAMP3⁺ DC Pole Localizes to the Tumour Border
- 958 LAMP3⁺ migratory dendritic cells partition into a mature pole (n = 272) and an arrested pole (n = 130) median 7.6 versus 17.1 µm from the nearest malignant cell
- The arrested pole is CCR7-low, CD83-low, ISG-high, and shows density-independent CD40 reduction (β = −0.86, p = 1.5 × 10⁻⁵)
- Non-canonical NF-κB output is collapsed (β = −0.87, p = 3.3 × 10⁻¹⁸) despite intact upstream LTβR
Methodological Takeaway for Spatial-Omics
- Composite Hallmark scores rise with local cell, immune, or malignant density — they report neighbourhood density by default
- Any cell-cell-signalling claim from spatial data should be reported with multivariable density adjustment, cell-subtype resolution, and a density-matched negative control
- The transferable element of this study is the methodology; the negative outcome is section-specific
Therapeutic Hypothesis
- For HPV-negative cervical tumours presenting triad geometry without maturation: a CD40 agonist to bypass the downregulated receptor, paired with FLT3L to expand the background-poor cDC compartment
- Testable in a multi-patient cohort with matched density strata and protein-level CD40 / CD40L measurement
Methods and source artifacts
Single 10x Atera WTA Preview FFPE cervical squamous cell carcinoma section; ~18,000 gene symbols; processed with miratyper --panel all --run-malignant, tissue prior UBERON:0000995 α 1/10; MiraTyper proprietary gene-embedding model, 98.7% panel coverage. All effect sizes are Cliff’s δ (rank-biserial); |δ| < 0.15 negligible, 0.15–0.33 small, 0.33–0.47 medium, > 0.47 large.
| Technical report | Full methods, complete numerical results, supplementary figures, OLS tables, and literature cross-references |
| Specimen | 10x Atera WTA Preview FFPE, HPV-negative cervical squamous cell carcinoma |
| Pipeline | MiraTyper cell-type and malignancy inference (--panel all --run-malignant) |
| Tissue prior | UBERON:0000995 (uterus), α = 1/10 |
| Symbol coverage | MiraTyper proprietary gene-embedding model, 98.7% of panel matched |
Ready to Classify Your Cells?
See how MiraTyper can deliver accurate, reproducible cell type and malignancy annotations on your spatial-transcriptomics datasets.