MiraTyper Performance on Pancreatic Type 2 Diabetes Single-Cell Datasets
Confidence-stratified evaluation on two independent pancreatic islet datasets, with systematic annotation correction and marker-gene analysis of error mechanisms.
Introduction
Single-cell RNA sequencing is now a core technology across academic labs, biotech, and drug development. However, accurate cell type annotation remains a key bottleneck: it is time-consuming, sensitive to dataset-specific effects, and often hard to reproduce across studies.
At MiraOmics, we developed the MiraTyper suite of models to address this problem in a robust, uniform, easy-to-use, and easy-to-deploy way. We trained MiraTyper on a carefully curated subset of CellXGene to emphasize batch diversity, cell-type balance, sample diversity, and robustness across assay types.
Previous approaches to cell type annotation
In practice, most annotation strategies fall into three broad categories.
Manual annotation remains common, especially in exploratory analyses. Typical workflows combine dimensionality reduction (e.g., PCA/UMAP), clustering, marker gene inspection, and iterative re-analysis. While powerful, manual labeling is labor-intensive and can produce coarse or inconsistent labels across studies.
Reference-based methods reduce manual effort by mapping a query dataset to a labeled reference atlas. Classic approaches and tools such as SingleR[1], scmap[2], and Garnett[3] use curated references (and often marker-informed or correlation-based matching) to infer labels. CellTypist[4] provides high-quality immune-focused models, but still relies on pretrained references and label schemas.
Modern foundation and deep-learning approaches have improved representation learning for scRNA-seq, but many production workflows still incorporate explicit reference mapping for interpretability and label transfer, or fine tuning on case-study specific data sets. For example, Seurat’s anchor-based integration[5] and its multimodal extensions[6] depend on curated reference objects and consistent label ontologies.
Evaluation overview
In this case study, we evaluate MiraTyper on pancreatic single-cell datasets from two independent Type 2 Diabetes studies: Ngara (GSE153855) and Avrahami (GSE154126). We use confidence-stratified evaluation with systematic annotation corrections and marker-gene analysis of error mechanisms, providing a more complete picture than simple accuracy metrics.
| Total cells evaluated | 3,974 (after excluding 34 Unknown cells) |
| Datasets | Ngara (GSE153855, 3,383 cells)[7,8], Avrahami (GSE154126, 625 cells)[9,10] |
| Disease state | Type 2 Diabetes |
| Annotation corrections | 600 labels corrected across 4 systematic rules |
| High-confidence accuracy (conf ≥ 0.5) | 96.2% exact match (77.8% coverage) |
| All-cell accuracy | 82.3% exact match |
Our classifier provides fine-grained, ontology-grounded predictions evaluated through a confidence-stratified framework. Rather than a single accuracy number, this approach reveals where the model is confident and correct, where it identifies annotation issues, and where residual errors concentrate — along with their biological mechanisms.
At the confidence ≥ 0.5 operating point, MiraTyper retains 77.8% of cells with 96.2% exact-match accuracy, rising to 98.0% within 2 ontology hops. Low-confidence predictions are not noise — they often flag biologically interesting transitional states and annotation inconsistencies.
Hierarchical Classification Summary
Predictions were classified into hierarchical correctness categories using the Cell Ontology graph: Correct (exact match), More Precise (model predicts a valid subtype of the author label), Less Precise (model predicts a more general ancestor), Sibling (prediction shares a direct parent with truth), and Other Incorrect (none of the above).
| Threshold | Dataset | Correct | More Precise | Less Precise | Sibling | Other Incorrect | Count |
|---|---|---|---|---|---|---|---|
| conf ≥ 0.5 | Ngara | 96.0% | 0.7% | 1.2% | 0.2% | 1.8% | 2,672 |
| Avrahami | 96.9% | 0.0% | 0.0% | 0.0% | 3.1% | 420 | |
| Combined | 96.2% | 0.6% | 1.0% | 0.2% | 2.0% | 3,092 | |
| All cells | Ngara | 82.9% | 1.2% | 3.3% | 1.0% | 11.6% | 3,355 |
| Avrahami | 78.8% | 0.0% | 0.8% | 3.7% | 16.6% | 619 | |
| Combined | 82.3% | 1.0% | 2.9% | 1.4% | 12.4% | 3,974 |
At the confidence ≥ 0.5 operating point, the model retains 77.8% of cells (3,092 of 3,974) with 96.2% exact-match accuracy. Of the remaining errors, 1.8% are ontologically close (More Precise + Less Precise + Sibling), and only 2.0% are further.
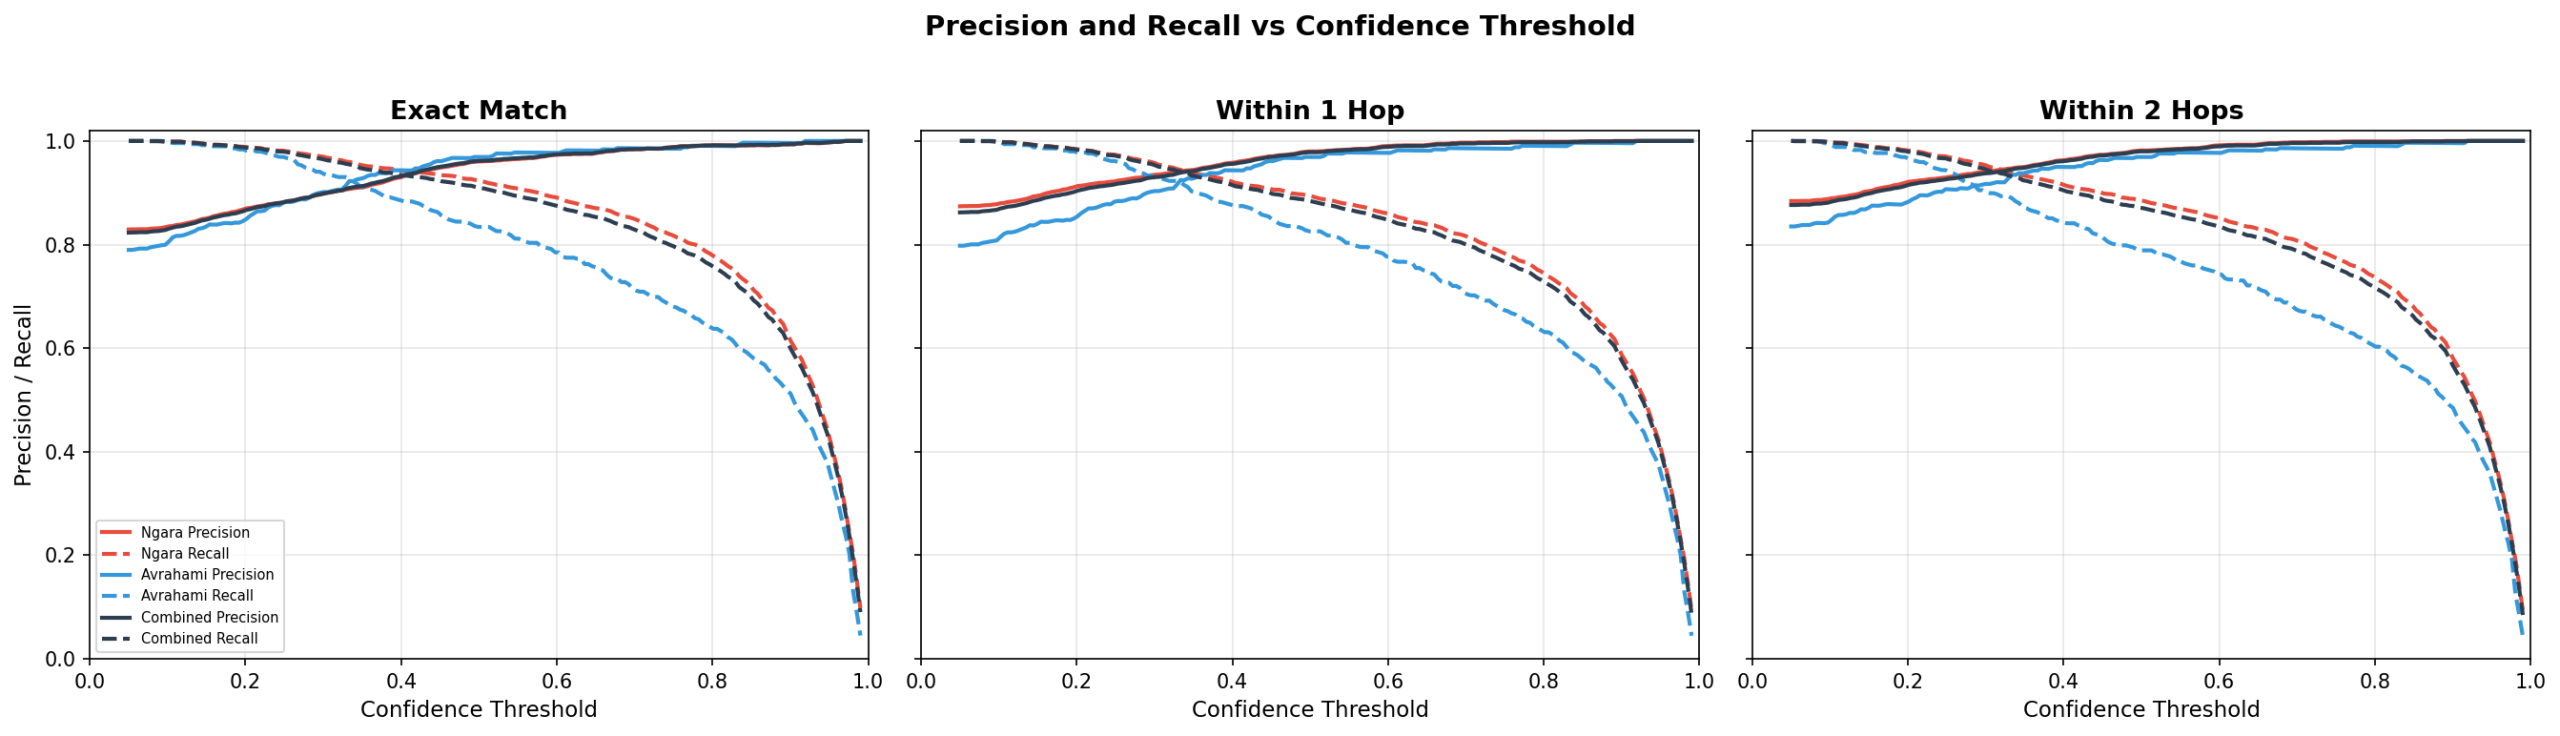
Confidence Threshold Operating Point
The correct confidence threshold depends on the purpose of the evaluation. If accurate cell typing for downstream analysis is the main concern, the 0.5 threshold provides a good tradeoff between accuracy and coverage. If the goal is more direct analysis, low-confidence predictions can actually point toward interesting and atypical biological processes.
| Confidence | Precision | Recall | F1 | Coverage | Cells |
|---|---|---|---|---|---|
| 0.0 (all) | 82.3% | 100.0% | 90.3% | 100.0% | 3,974 |
| 0.1 | 83.0% | 99.9% | 90.6% | 99.0% | 3,936 |
| 0.2 | 86.7% | 98.7% | 92.3% | 93.7% | 3,724 |
| 0.3 | 89.9% | 96.5% | 93.0% | 88.3% | 3,509 |
| 0.4 | 93.2% | 93.4% | 93.3% | 82.5% | 3,277 |
| 0.5 | 96.2% | 90.9% | 93.5% | 77.8% | 3,092 |
| 0.6 | 97.4% | 87.5% | 92.2% | 74.0% | 2,939 |
| 0.7 | 98.4% | 82.9% | 90.0% | 69.3% | 2,754 |
| 0.8 | 99.2% | 75.8% | 85.9% | 62.9% | 2,499 |
| 0.9 | 99.4% | 60.0% | 74.8% | 49.6% | 1,973 |
Author Label Issues
Four systematic annotation issues were identified by cross-referencing model predictions, Cell Ontology structure, and marker gene expression. Correcting these changed 600 cell labels and raised exact-match accuracy from 66.6% to 82.3%.
| Rule | Author Label | Model Prediction | Correction | Cells | Dataset |
|---|---|---|---|---|---|
| 1 | Unknown | — | Exclude (no ground truth) | 34 | Both |
| 2 | pancreas exocrine glandular cell | pancreatic acinar cell or ductal cell | Accept subtype (ontology-validated) | 453 of 468 | Ngara |
| 3 | pancreatic PP cell | PP cell | Synonym (PP cells only exist in pancreas) | 116 | Both |
| 4 | mesenchymal cell | fibroblast / fibroblast-lineage | Accept specialization | 31 | Avrahami |
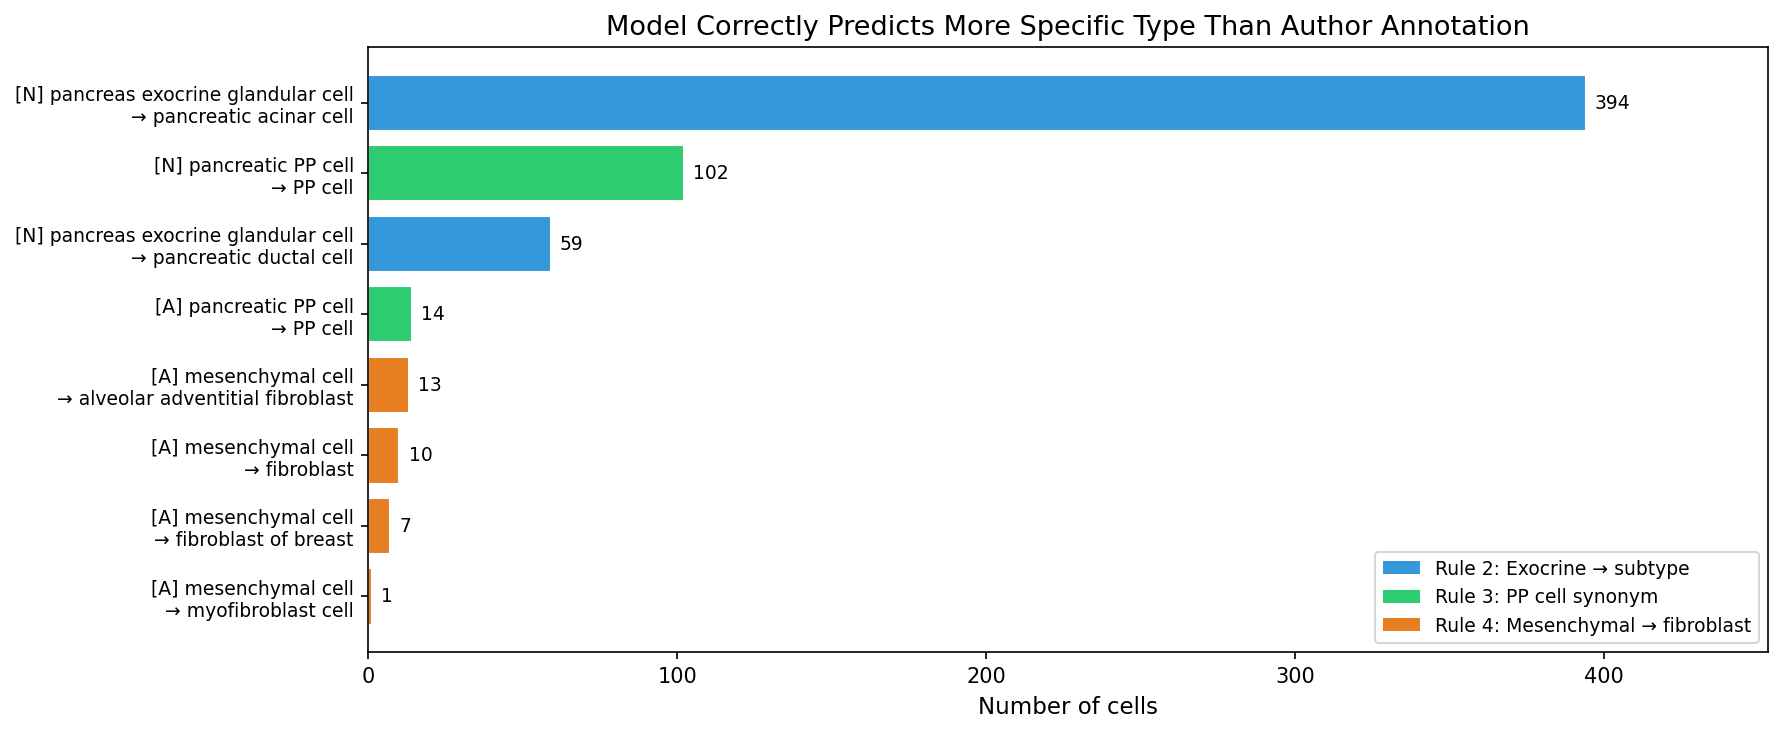
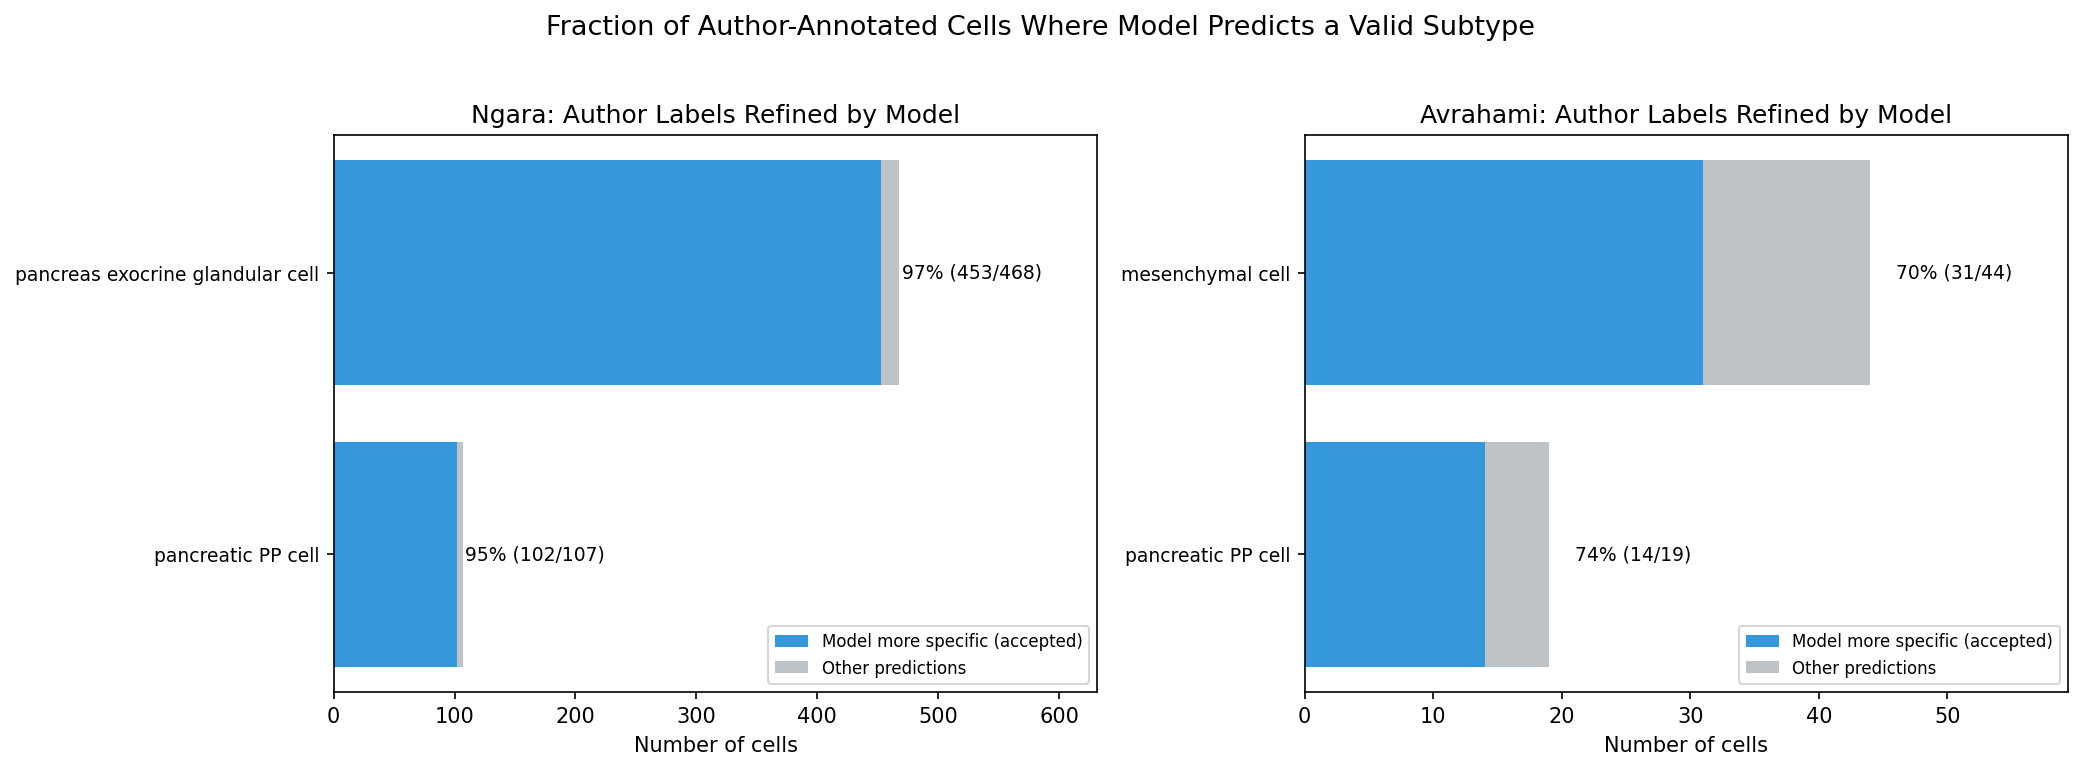
Model more specific than author annotation
In 600 cases, the model predicts a valid, more specific cell type than the author’s annotation. These are not errors — the model correctly resolves heterogeneity that the authors annotated at a coarser level.
Rule 2 — Exocrine glandular cell: The authors labeled 468 cells as “pancreas exocrine glandular cell,” a parent term in the Cell Ontology. Marker analysis confirms two transcriptionally distinct subpopulations: 67.3% express acinar markers (REG1A mean 27,311; CPA1 mean 13,625; 100% expressing) and 30.8% express ductal markers (KRT19, CFTR). The model correctly resolves 453 of 468 (96.8%) into acinar or ductal subtypes.
Rule 3 — PP cell synonym: “Pancreatic PP cell” and “PP cell” refer to the same biological entity. PP cells exist only in the pancreas. The model predicts “PP cell” (the Cell Ontology preferred name) for 116 cells labeled “pancreatic PP cell.”
Rule 4 — Mesenchymal cell: In scRNA-seq annotation, “mesenchymal cell” is commonly used as a catch-all for stromal cells. The model predicts fibroblast-lineage subtypes for 31 of 50 mesenchymal cells (62%), consistent with their transcriptional profiles.
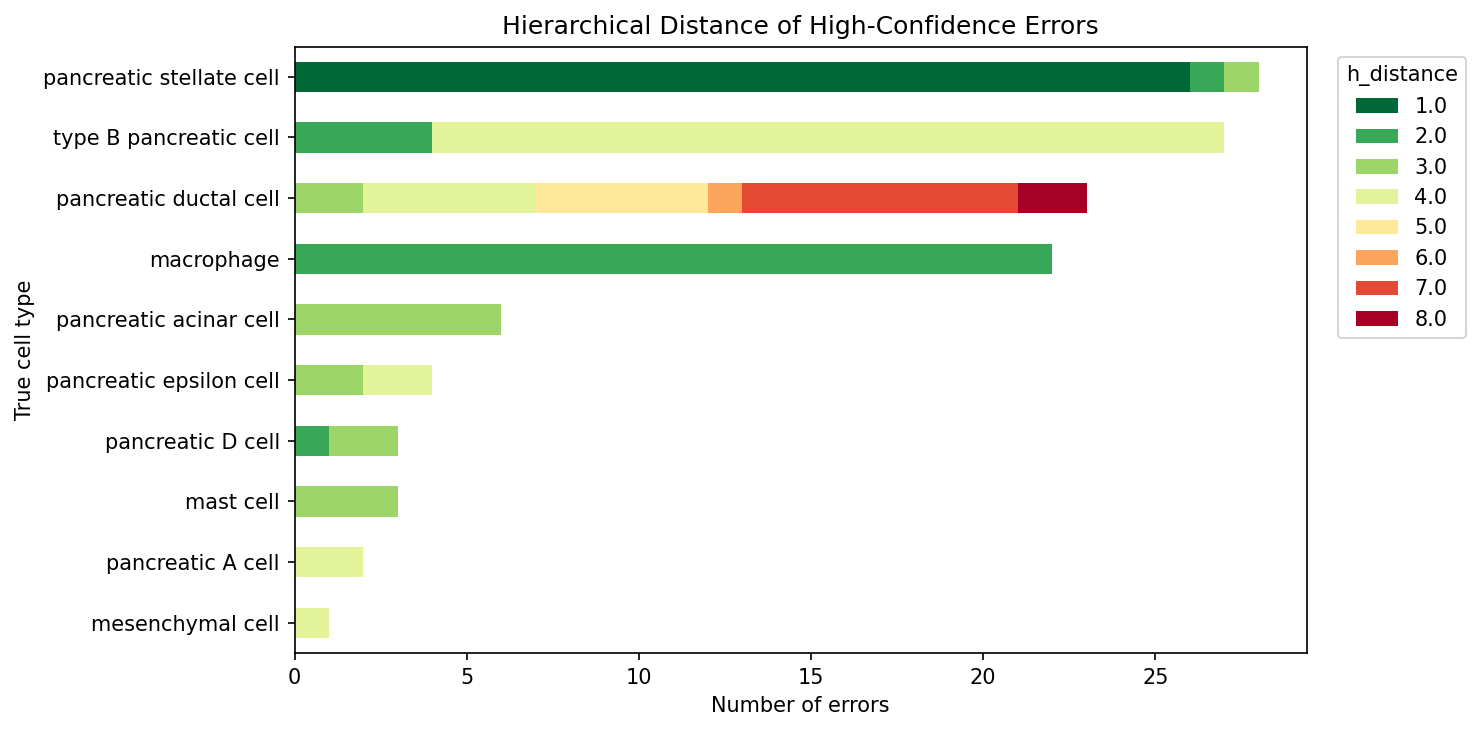
High-Confidence Error Breakdown
Of 3,092 high-confidence predictions (after annotation corrections), 119 are errors (3.8%). These errors fall into four categories based on their Cell Ontology distance from the true label.
| Category | Distance | Count | % of Errors | Examples |
|---|---|---|---|---|
| Correct lineage, too coarse | 1 | 26 | 21.8% | stellate → fibroblast |
| Sibling / grandparent | 2 | 28 | 23.5% | macrophage → alveolar macrophage |
| Moderate distance | 3 | 16 | 13.4% | acinar → ductal |
| Far ontological distance | 4–8 | 49 | 41.2% | beta → neuroendocrine; ductal → trophoblast |
Mean ontological distance of errors: 3.07. Median: 3.0. The close errors (distance 1–2, 45.4%) represent the model predicting at a different specificity level within the correct lineage. The distant errors (distance ≥ 4, 41.2%) cluster in two mechanistically distinct groups: identity-marker loss in endocrine cells and atlas-gap predictions for ductal cells.
| True Type | HC Cells | HC Errors | HC Error Rate | Primary Misclassification |
|---|---|---|---|---|
| Type B pancreatic cell | 477 | 27 | 5.7% | Neuroendocrine cell (d=4) |
| Pancreatic stellate cell | 28 | 28 | 100.0% | Fibroblast (d=1) |
| Pancreatic ductal cell | 62 | 23 | 37.1% | Trophoblast (d=7), hepatocyte (d=4) |
| Macrophage | 22 | 22 | 100.0% | Alveolar macrophage (d=2) |
| Pancreatic acinar cell | 393 | 6 | 1.5% | Ductal cell (d=3) |
| Pancreatic epsilon cell | 4 | 4 | 100.0% | Neuroendocrine cell (d=4) |
| Pancreatic D cell | 225 | 3 | 1.3% | Neuroendocrine cell (d=3) |
| Pancreatic A cell | 1,777 | 2 | 0.1% | Enteroendocrine cell (d=4) |
Stellate and macrophage cells are 100% wrong even at high confidence — the model consistently predicts a lineage-correct but insufficiently specific type. The 27 beta cell errors and 23 ductal errors are analyzed in detail below.
High-Confidence Error Causes
Of the 119 high-confidence errors, marker gene analysis reveals three distinct mechanisms.
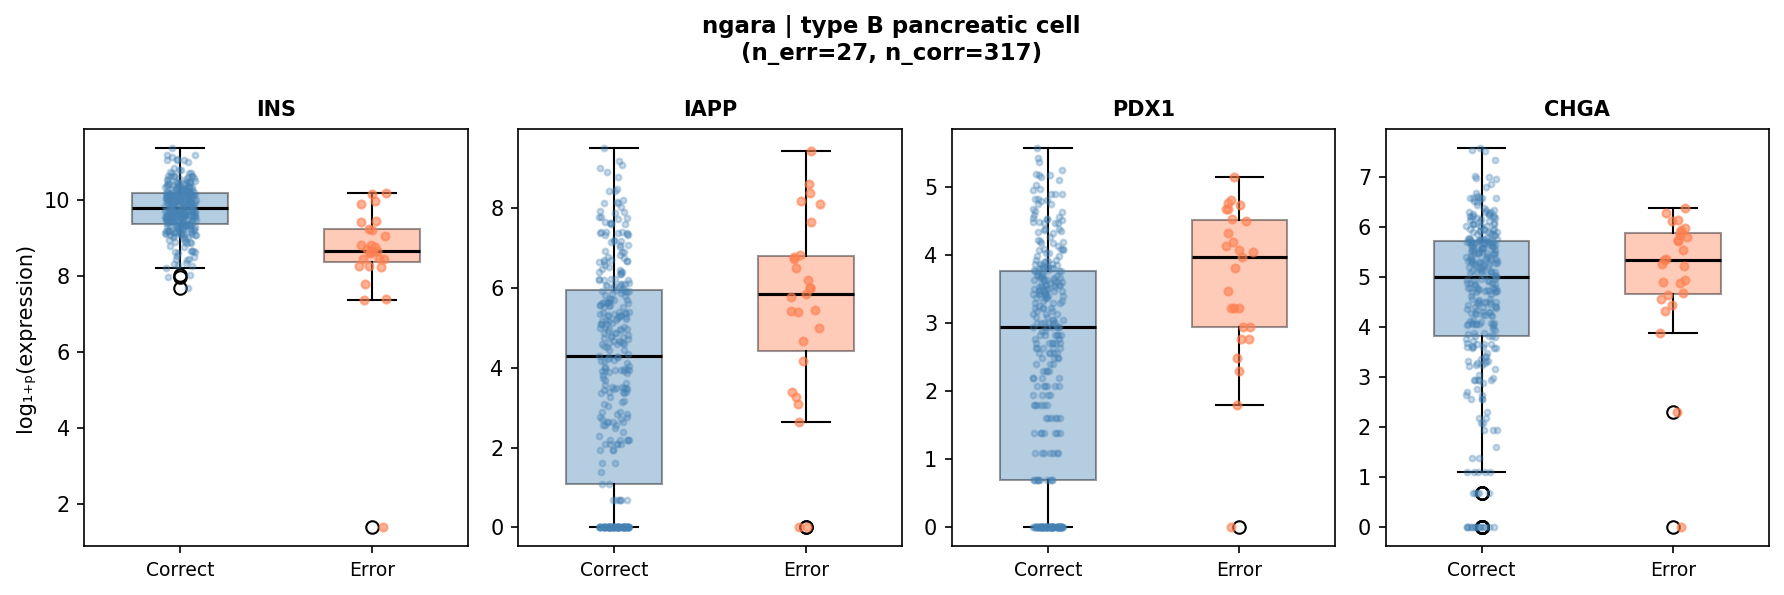
1. Identity-marker loss (55% of high-confidence errors)
The dominant cause of high-confidence misclassification is reduced expression of the cell type’s defining secretory product. These cells retain their lineage transcription factor programs but have low mRNA for the key functional gene, causing the model to lose the type-specific signal.
| True Type | Marker | Error Mean | Correct Mean | p-value | nerr / ncorr |
|---|---|---|---|---|---|
| Type B pancreatic cell | INS (insulin) | 8,470 | 20,803 | 3.9 × 10⁻⁹ | 27 / 317 |
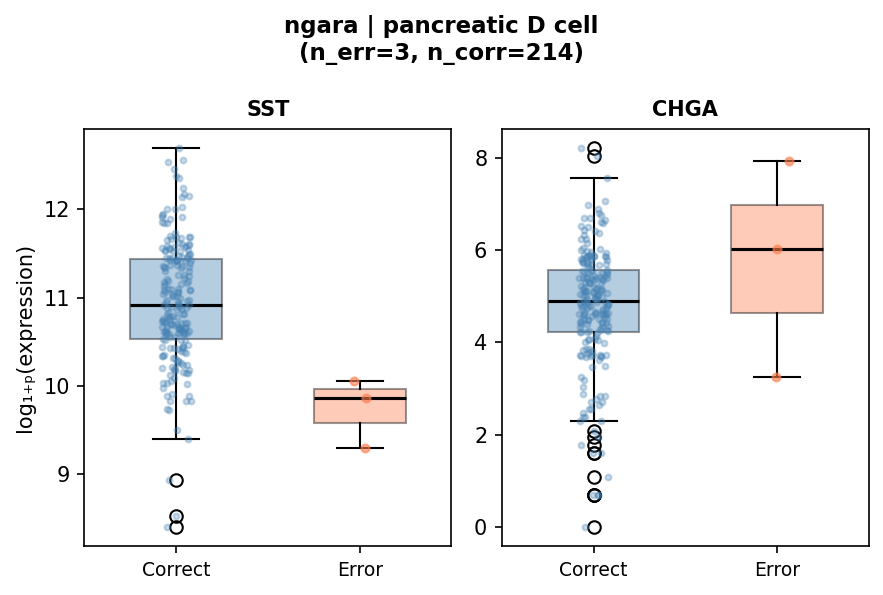
| Pancreatic D cell | SST (somatostatin) | 17,860 | 70,897 | 1.4 × 10⁻³ | 3 / 214 |
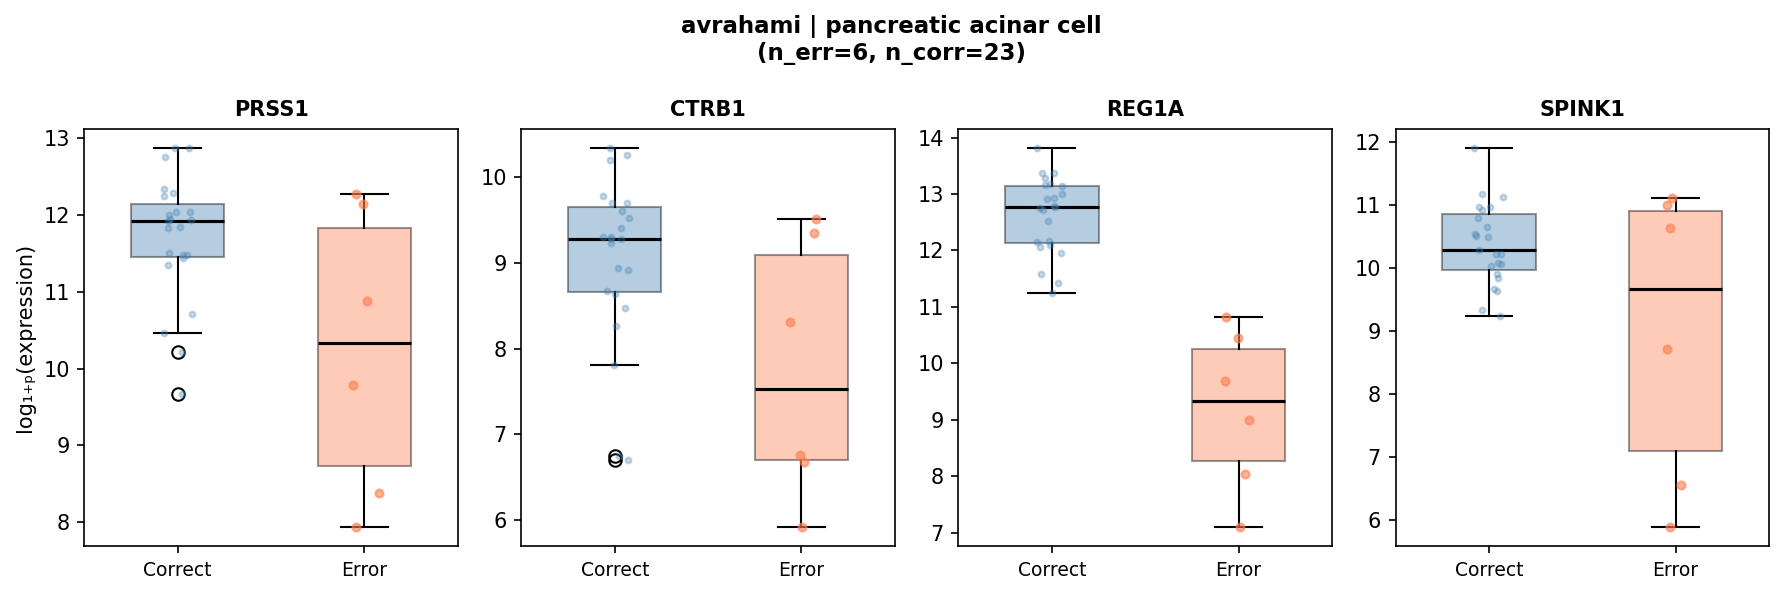
| Pancreatic acinar cell | REG1A | 18,821 | 370,199 | 4.2 × 10⁻⁶ | 6 / 23 |
The beta cell finding is the most statistically robust (n=27 errors vs. 317 correct, p=3.9 × 10⁻⁹). These 27 cells represent the low-INS tail of the beta cell population. Paradoxically, IAPP (amylin, p=2.5 × 10⁻³) and PDX1 (transcription factor, p=5.5 × 10⁻⁴) are upregulated in error cells, consistent with metabolically exhausted or immature beta cells that retain transcription-factor identity but have reduced insulin mRNA.
The 6 acinar errors (all predicted as ductal, Avrahami) show 20-fold REG1A reduction, consistent with acinar-to-ductal metaplasia (ADM) — a well-characterized biological transition in pancreatic injury.
2. Atlas-gap predictions (34% of high-confidence errors)
Ductal cell errors (23 total, 19 Ngara + 4 Avrahami) are predicted as tissue-inappropriate types at high ontological distance: placental villous trophoblast (d=7), pulmonary alveolar type 1 cell (d=5), hepatocyte (d=4), and malignant cell (d=8). These errors reflect a training-vocabulary gap: the model has insufficient representation of pancreatic ductal subtypes and defaults to the nearest epithelial type it knows.
3. Lineage-correct granularity errors (11% of high-confidence errors)
Stellate → fibroblast (26 errors, d=1) and macrophage → alveolar macrophage (20 errors, d=2) are predictions within the correct lineage at the wrong specificity level. These are the least biologically concerning errors since the predicted type is a valid relative of the true type.
Low-Confidence Error Breakdown
Cells below the confidence threshold (< 0.5) account for 22.2% of all corrected cells (882 of 3,974). These low-confidence cells are where the majority of errors concentrate: 583 errors (66% error rate vs. 3.8% in the high-confidence set).
| True Type | LC Cells | LC Errors | LC Error Rate | Primary Misclassification |
|---|---|---|---|---|
| Pancreatic ductal cell | 327 | 277 | 84.7% | Trophoblast, hepatocyte, alveolar type 1 |
| Type B pancreatic cell | 260 | 133 | 51.2% | Neuroendocrine cell, germ cell |
| Pancreatic stellate cell | 98 | 95 | 96.9% | Fibroblast, preadipocyte |
| Exocrine glandular cell | 15 | 15 | 100.0% | (not corrected by Rule 2) |
| Mesenchymal cell | 12 | 12 | 100.0% | (not corrected by Rule 4) |
| Endothelial cell | 19 | 12 | 63.2% | Various (no HC cells at all) |
| Macrophage | 12 | 11 | 91.7% | Alveolar macrophage, myeloid cell |
| Pancreatic A cell | 30 | 11 | 36.7% | Enteroendocrine subtypes |
| Pancreatic PP cell | 10 | 10 | 100.0% | (not resolved by Rule 3) |
The low-confidence band concentrates 83% of all errors (586 of 705). Ductal cells alone account for 47% of low-confidence errors. Several cell types (endothelial, exocrine glandular, PP cell) have zero high-confidence predictions — the model never reaches conf ≥ 0.5 for these types, indicating a systematic vocabulary gap rather than per-cell difficulty.
Insufficient precision
Ductal cells are the largest source of low-confidence errors. Of 330 ductal cells across both datasets, only 21 (6.4%) are predicted correctly at any confidence level. The model maps ductal expression profiles to epithelial types from other tissues because pancreatic ductal cells are underrepresented in the training atlas relative to their transcriptional diversity.
Stellate cells (126 total, 97.6% error rate) are consistently predicted as fibroblast (d=1), a lineage-correct but insufficiently specific prediction. The model recognizes the mesenchymal program but cannot distinguish pancreas-specific stellate cells from generic fibroblasts.
Epsilon cells (9 total, 100% error rate) are predicted as neuroendocrine or enteroendocrine subtypes. With only 9 cells in the evaluation set and minimal representation in training data, the model defaults to the broader endocrine category.
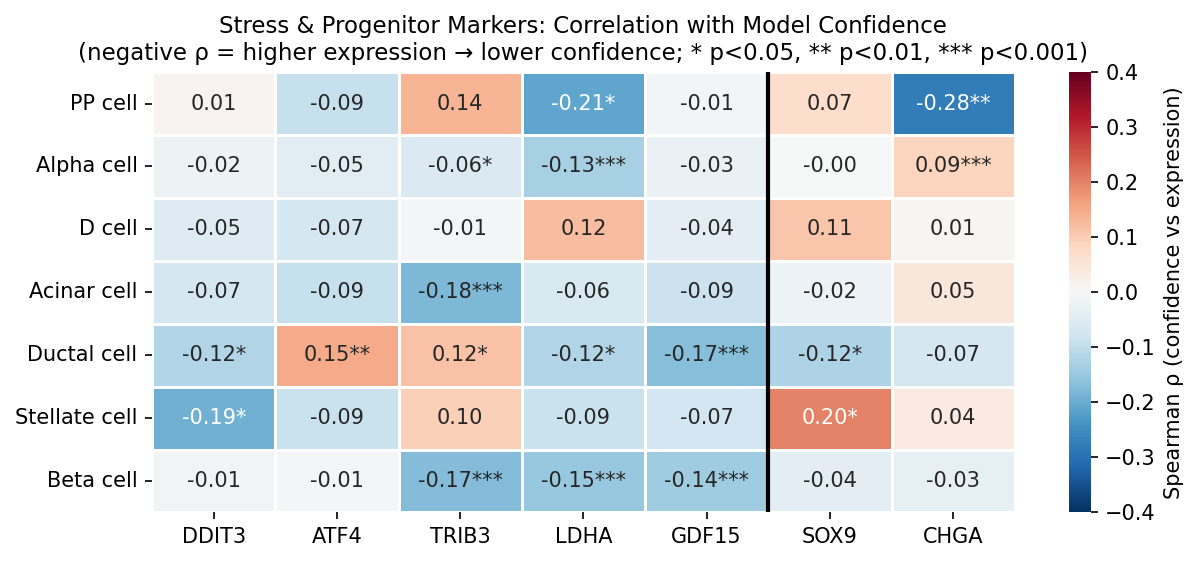
Stress and Endocrine Promiscuity
To investigate whether cellular stress or dedifferentiation drives low model confidence, we computed Spearman rank correlations between continuous confidence and marker expression per cell type and per dataset. This approach uses all data points and is not sensitive to the choice of confidence cutoff.
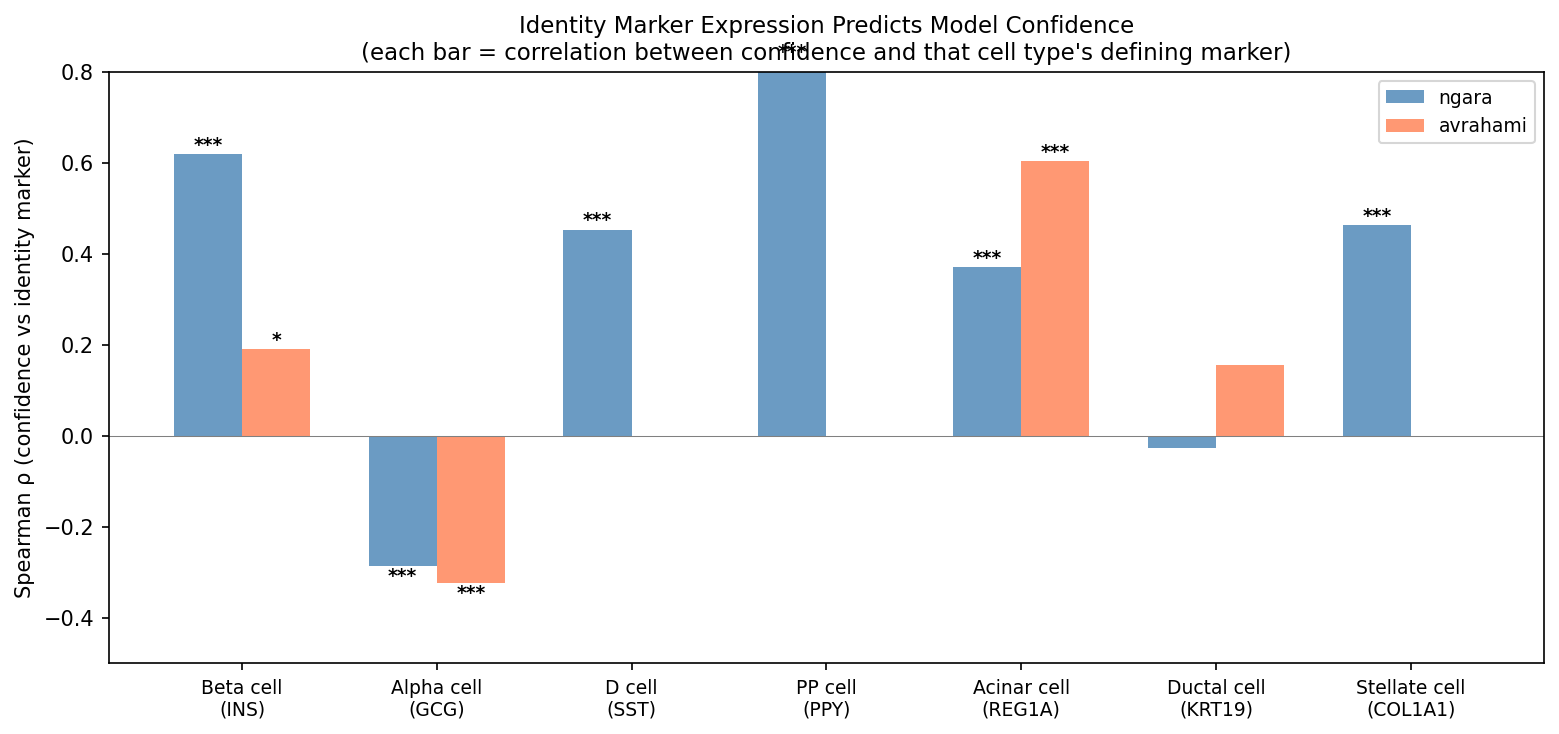
Identity-marker expression dominates confidence
The strongest predictor of model confidence is expression of each cell type’s defining identity marker.
| Cell Type | Identity Marker | Ngara ρ | Avrahami ρ |
|---|---|---|---|
| Type B pancreatic cell | INS | +0.619 (p=5.3×10−60) | +0.190 (p=0.010) |
| Pancreatic D cell | SST | +0.453 (p=1.1×10⁻¹²) | — |
| Pancreatic acinar cell | REG1A | +0.370 (p=3.0×10⁻¹⁴) | +0.603 (p=4.2×10⁻⁴) |
| Pancreatic stellate cell | COL1A1 | +0.463 (p=5.0×10⁻⁸) | — |
Insulin expression alone explains more variance in beta cell confidence (ρ=+0.619) than any combination of stress markers. This is consistent with the high-confidence error analysis above, where INS reduction was the dominant signal in misclassified beta cells.
Metabolic stress: modest but consistent signal
LDHA (lactate dehydrogenase A, a glycolysis/hypoxia marker) shows a modest but consistent negative correlation with confidence across cell types and both datasets.
| Cell Type | Ngara ρ | Avrahami ρ |
|---|---|---|
| Type B pancreatic cell | -0.147 (p=4.9×10⁻⁴) | -0.270 (p=2.3×10⁻⁴) |
| Pancreatic A cell | -0.158 (p=3.1×10⁻¹⁰) | ns |
| Pancreatic acinar cell | -0.167 (p=8.8×10⁻⁴) | ns |
| Pancreatic ductal cell | -0.116 (p=0.048) | ns |
| PP cell | -0.267 (p=0.007) | — |
Other stress markers show weaker or dataset-specific associations: TRIB3 (ρ=-0.200, beta cells, Ngara only), GDF15 (ρ=-0.194, beta cells, Ngara only). ER stress markers (DDIT3, ATF4) are not significantly correlated with confidence in beta cells in either dataset.
Endocrine promiscuity in low-confidence beta cells
Low-confidence beta cells co-express markers of other endocrine lineages. GCG (glucagon, alpha cell marker) and SST (somatostatin, delta cell marker) both show negative correlations with beta cell confidence:
- GCG: Ngara ρ=-0.114 (p=0.007), Avrahami ρ=-0.236 (p=0.001) — consistent across datasets
- SST: Ngara ρ=-0.141 (p=0.0008)
This suggests that some low-confidence beta cells have mixed endocrine identity profiles, co-expressing hormones from multiple lineages. This is distinct from dedifferentiation: these cells retain INS expression but additionally express competing lineage markers, creating an ambiguous transcriptional profile that reduces model confidence.
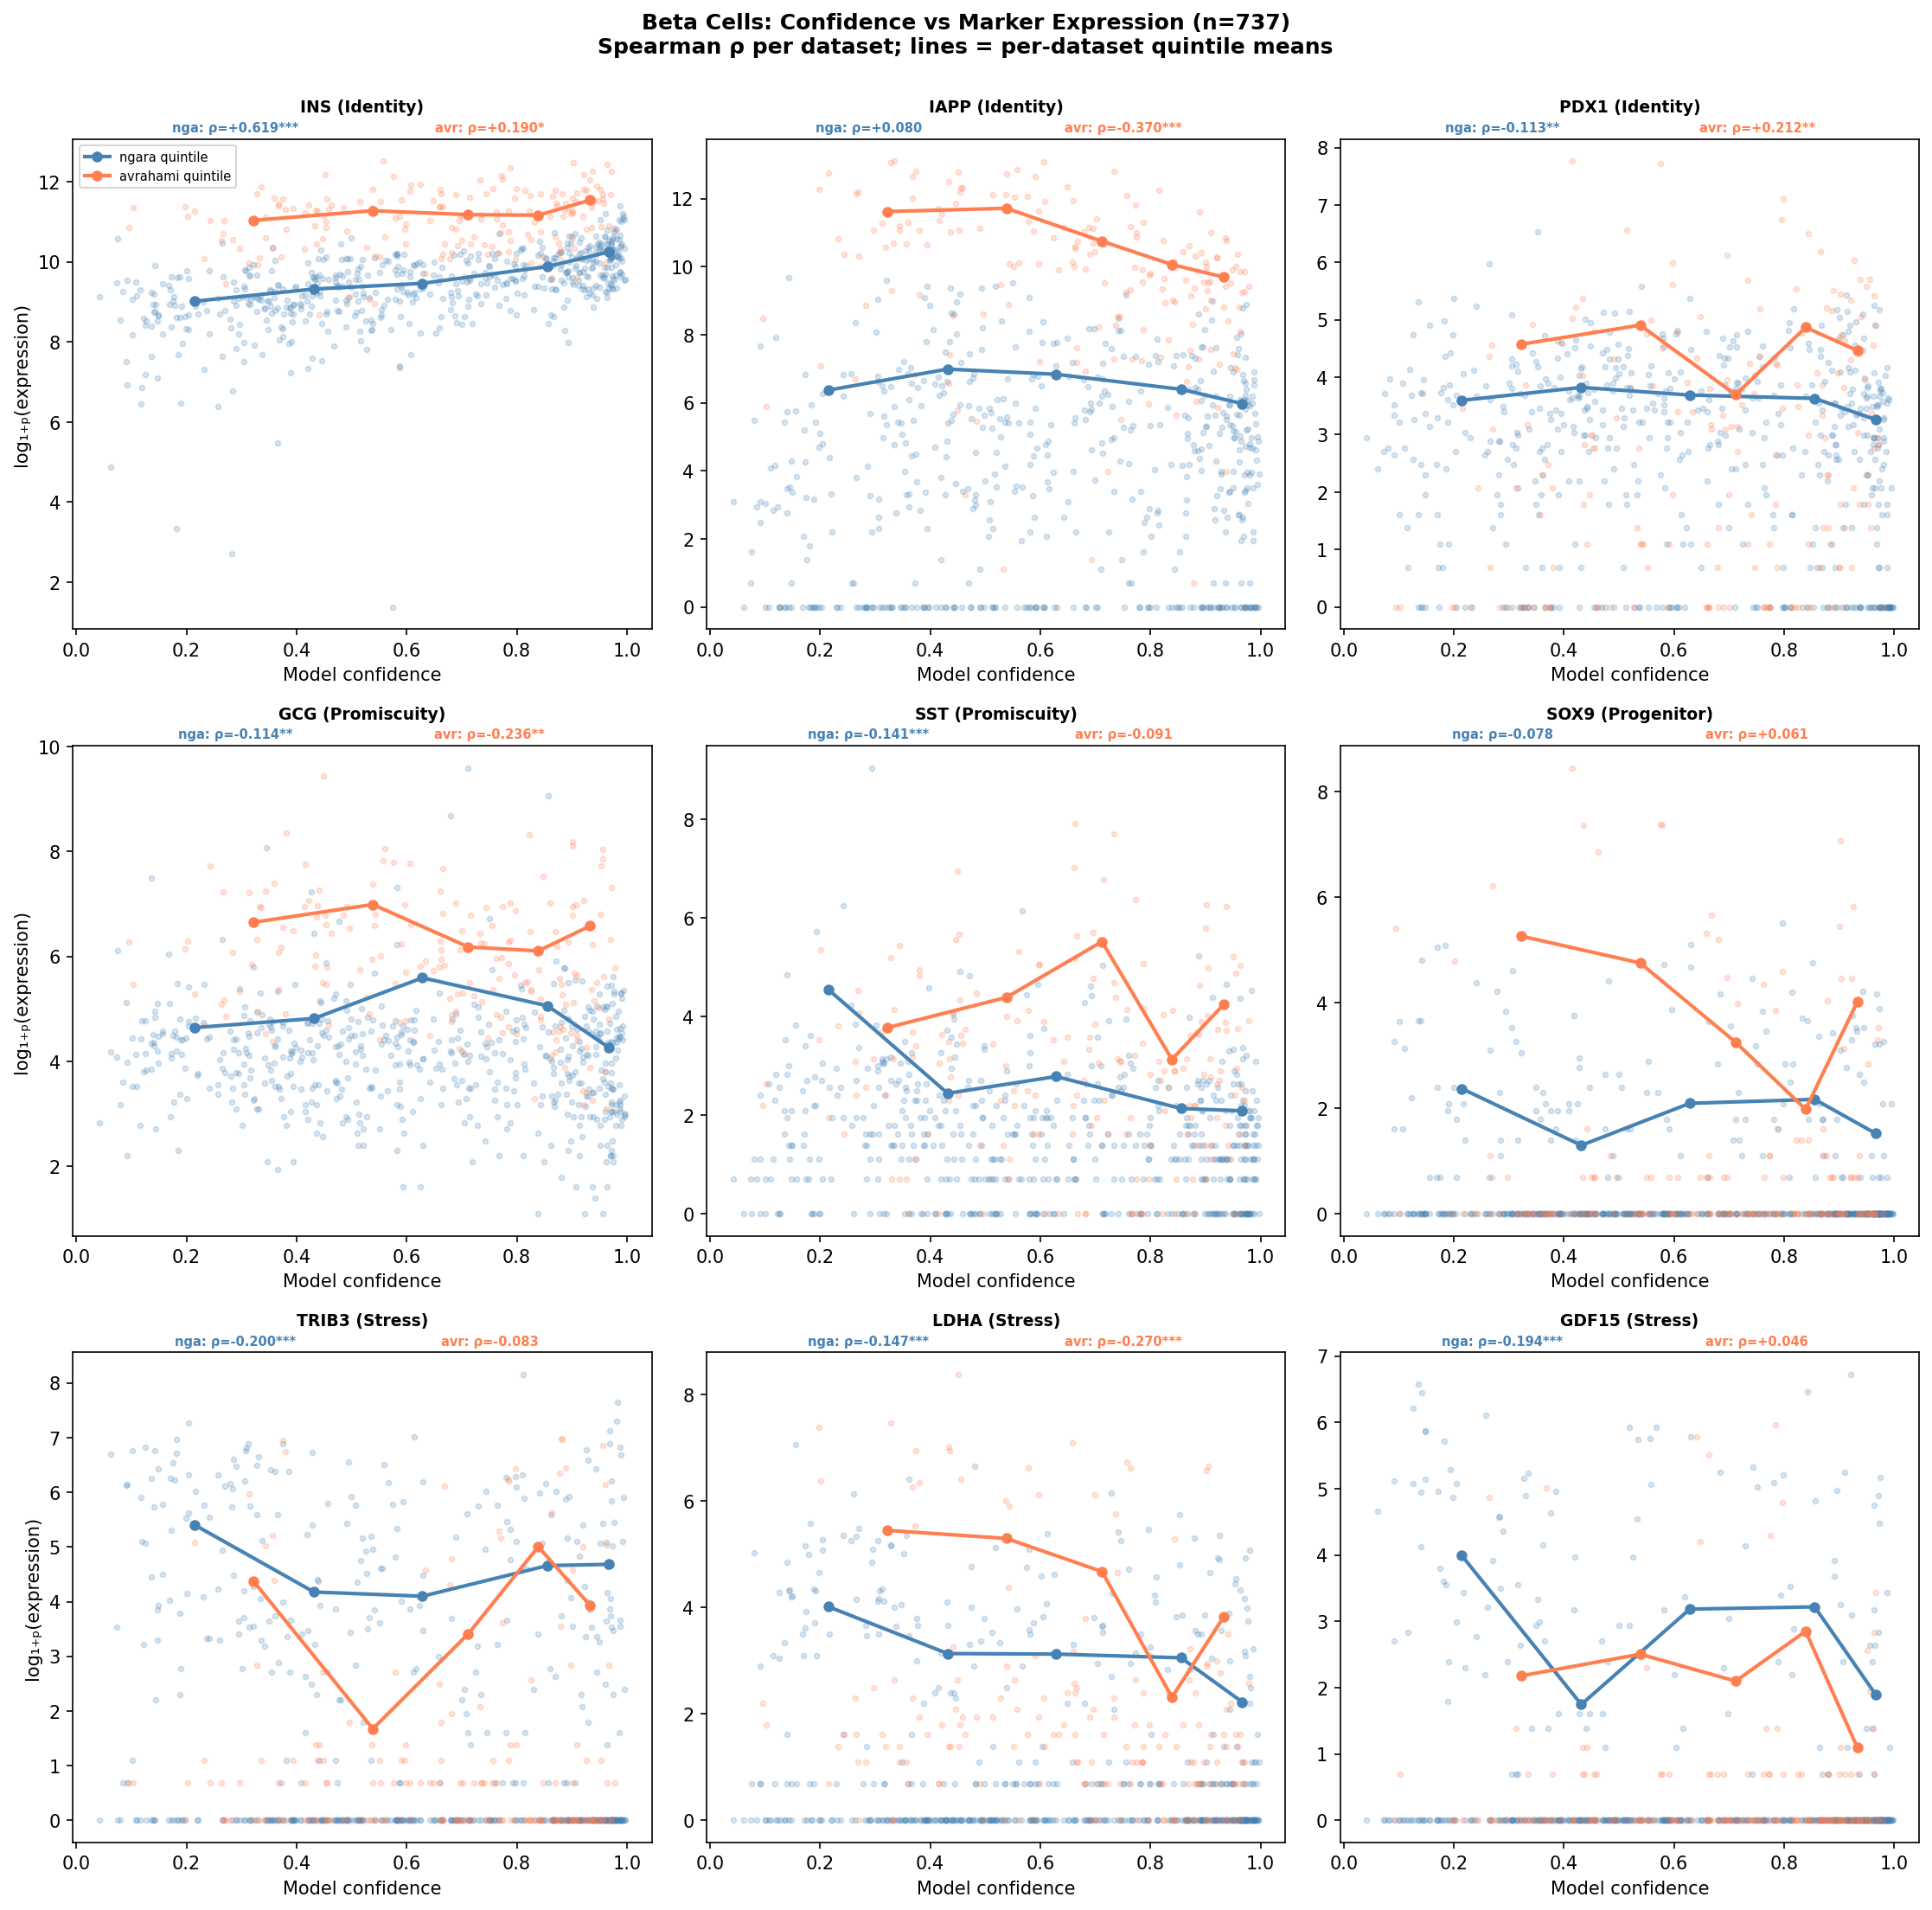
Full dedifferentiation not supported
Correlation analysis across both datasets does not support a narrative of full dedifferentiation:
- PDX1 (beta cell transcription factor): not significant in either dataset (Ngara ρ=-0.113; Avrahami ρ=+0.212 — opposite directions)
- SOX9 (ductal/progenitor marker): not significant in either dataset
- DDIT3, ATF4 (ER stress markers): not significant in beta cells in either dataset
- IAPP (amylin, co-secretory product): Ngara ns; Avrahami ρ=-0.370 — inconsistent across datasets
The picture that emerges is not dedifferentiation but rather identity-marker dilution with modest metabolic stress: cells with lower confidence have reduced expression of their defining identity marker and modestly elevated glycolytic markers (LDHA), but retain their transcription factor program (PDX1 unchanged) and do not activate progenitor markers (SOX9 unchanged). Low-confidence beta cells additionally show endocrine promiscuity (co-expression of GCG and SST), suggesting mixed lineage identity rather than lineage regression.
Conclusions
This analysis provides a detailed confidence-stratified evaluation of MiraTyper on two independent T2D pancreatic datasets:
Confidence-Stratified Accuracy
- 96.2% exact-match accuracy at conf ≥ 0.5 (77.8% coverage)
- 98.0% accuracy within 2 ontology hops at the same threshold
- 3.8% residual high-confidence errors split into three addressable categories
Annotation Quality Matters
- 600 systematic annotation corrections identified across 4 rules
- 16 percentage-point accuracy increase (66.6% → 82.3%) from corrections alone
- Benchmark accuracy is highly sensitive to annotation conventions
Errors Are Mechanistically Interpretable
- Identity-marker loss drives 55% of high-confidence errors (INS, SST, REG1A reduction)
- Atlas vocabulary gaps drive 34% (ductal cells mapped to other epithelia)
- Granularity mismatches account for 11% (stellate, macrophage)
Low Confidence = Biological Signal
- Identity marker expression is the dominant driver of confidence (ρ=+0.619 for INS)
- LDHA shows modest but consistent negative correlation across cell types
- Endocrine promiscuity — not dedifferentiation — characterizes low-confidence beta cells
The primary areas for model improvement are: (1) expanding ductal cell representation in the training atlas, (2) adding pancreas-specific stellate cell labels to the vocabulary, and (3) improving resolution of rare cell types (epsilon, mast, endothelial) that currently lack sufficient training examples.
References
- Aran, D. et al. Reference-based analysis of lung single-cell sequencing reveals a transitional profibrotic macrophage. Nature Immunology 20, 163-172 (2019).
- Kiselev, V.Y. et al. scmap: projection of single-cell RNA-seq data across data sets. Nature Methods 15, 359-362 (2018).
- Pliner, H.A. et al. Supervised classification enables rapid annotation of cell atlases. eLife 8, e45321 (2019).
- Dominguez Conde, C. et al. Cross-tissue immune cell analysis reveals tissue-specific features in humans. Science 376, eabl5197 (2022).
- Stuart, T. et al. Comprehensive Integration of Single-Cell Data. Cell 177, 1888-1902 (2019).
- Hao, Y. et al. Integrated analysis of multimodal single-cell data. Cell 184, 3573-3587 (2021).
- NCBI GEO. GSE153855: Single-cell RNA-seq of human pancreatic islets in type 2 diabetes (Ngara).
- Martinez-Lopez, I. et al. Single-cell mRNA-regulation analysis reveals cell type-specific mechanisms of type 2 diabetes. Nature Communications (2025).
- NCBI GEO. GSE154126: Single-cell RNA-seq of human islets in type 2 diabetes (Avrahami).
- Avrahami, D. et al. Single-cell transcriptomics of human islet ontogeny defines the molecular basis of beta-cell dedifferentiation in type 2 diabetes. Molecular Metabolism 42, 101057 (2020).
Ready to Classify Your Cells?
See how MiraTyper can deliver accurate, reproducible cell type annotations on your datasets.