MiraTyper Evaluation on Xenium 5K Human Lymph Node Spatial Transcriptomics
Independent marker-based validation, systematic error attribution, and ground-truth-free spatial coherence analysis on a 708,983-cell 10x Xenium dataset with 127 predicted cell types.
Executive Summary
We evaluated MiraTyper’s cell type predictions on a 10x Xenium human lymph node dataset against the vendor’s annotations. This report investigates where and why the two disagree, using marker expression, spatial context, morphology, and independent validation methods to adjudicate key cases.
| Dataset | 708,983 cells, 4,624 genes, 28 author-labeled types (10x Xenium spatial transcriptomics, human lymph node) |
| Model | xenium_5k/log1p panel (425 types, trained h-F1 = 0.90) |
| Raw h-F1 | 0.763 against vendor annotations |
| Corrected h-F1 | 0.813 after correcting a subset of validated author errors and ontology equivalences |
The corrected score underestimates MiraTyper’s true accuracy, since the corrections only covered a fraction of the disagreements. In the vast majority of disagreement cases examined in this report, the model is correct or defensible. Independent validation using canonical marker gates confirms model predictions are more accurate than author annotations across 4 validated cell types (Section 1). Spatial tissue architecture coherence — an axis that requires no ground truth — shows model labels produce more organized neighborhoods (76.5% of cells have lower entropy, d=0.70), higher zone purity (0.42 vs 0.31), and more anatomically plausible tissue zones (Section 7).
MiraTyper predicts 127 cell types from this dataset. An exhaustive analysis of all error modes would be very time consuming, so we examine the authors’ label that disagrees with MiraTyper’s predictions the most (naive thymus-derived CD4-positive, alpha-beta T cell), plus we touch on other labels. We use these examples to drive at the underlying source of the disagreement.
We identify four primary mechanisms, three of which are errors in the vendor’s annotations rather than model failures: (1) Author misannotation from Leiden clustering on cell cycle signal (~57K cells), (2) segmentation bleed-through from adjacent cells (~14.5K cells), (3) noisy interfaces at intimate cell-cell contacts (~7K cells), and (4) segmentation-induced malignant predictions in dense B cell regions (1.4K cells). Only mechanism (4) represents the model being influenced by a technical artifact; mechanisms (1)-(3) are cases where the model is correct and the authors’ labels are wrong. A deep investigation of the worst-performing author label (HSC, h-F1=0.41) reveals the entire 24,642-cell “HSC” population is a Leiden clustering artifact — none express HSC markers, and cells in each prediction subgroup express markers of their predicted type instead (Section 5).
This analysis shows that most disagreement between the authors’ labels and MiraTyper are a result of improved “resolution” and accuracy of MiraTyper’s predictions.
1. Marker-Based Ground Truth Validation
1.1 Motivation
Sections 4-6 of this report argue the model is often more correct than the author’s annotations, but the evidence is gathered case-by-case. In this section, we create high level labels using canonical marker expression — analogous to flow cytometry gating on transcriptomic data. Both the model predictions and the author annotations are evaluated against the same reference.
We select 4 cell types spanning large to rare populations: T cell, B cell, endothelial cell, and mast cell. For each, we define positive marker gates (GMM-derived thresholds on log1p expression) combined with negative lineage-exclusion gates to defend against spatial segmentation bleed-through — the dominant artifact in this dataset. This mirrors standard flow cytometry practice (e.g., CD3+/CD19−/CD56− for T cells).
1.2 Gating Strategy
| Cell Type | Positive Gate | Negative Gate | Rationale |
|---|---|---|---|
| T cell | CD3E+ | MS4A1−, CD79A−, PECAM1− | Gold standard; negative gates exclude B cell and endothelial bleed |
| B cell | MS4A1+ AND CD79A+ | CD3E− | Dual positive gate eliminates bleed; negative gate excludes T cell contamination |
| Endothelial | PECAM1+ AND CDH5+ | CD3E−, MS4A1− | Dual positive gate; negative gates remove immune bleed-through |
| Mast cell | KIT+ AND HPGDS+ | CD3E−, MS4A1− | Highly distinctive rare type; negative gates remove immune contamination |
Positive thresholds are set at the intersection of two Gaussian mixture model components fitted to each marker’s log1p expression across all 709K cells. The negative gates are critical: a B cell adjacent to a T cell may pick up CD3E transcripts through segmentation bleed-through, but it will still express MS4A1 — so the negative MS4A1 gate on the T cell panel catches it.
1.3 Results
For each gated population, we compute precision, recall, and F1 for both the model and author annotations, using the marker gate as ground truth. A prediction is “correct” if it maps to the gated type or any descendant in the Cell Ontology (e.g., “naive B cell” counts as correct for the B cell gate).
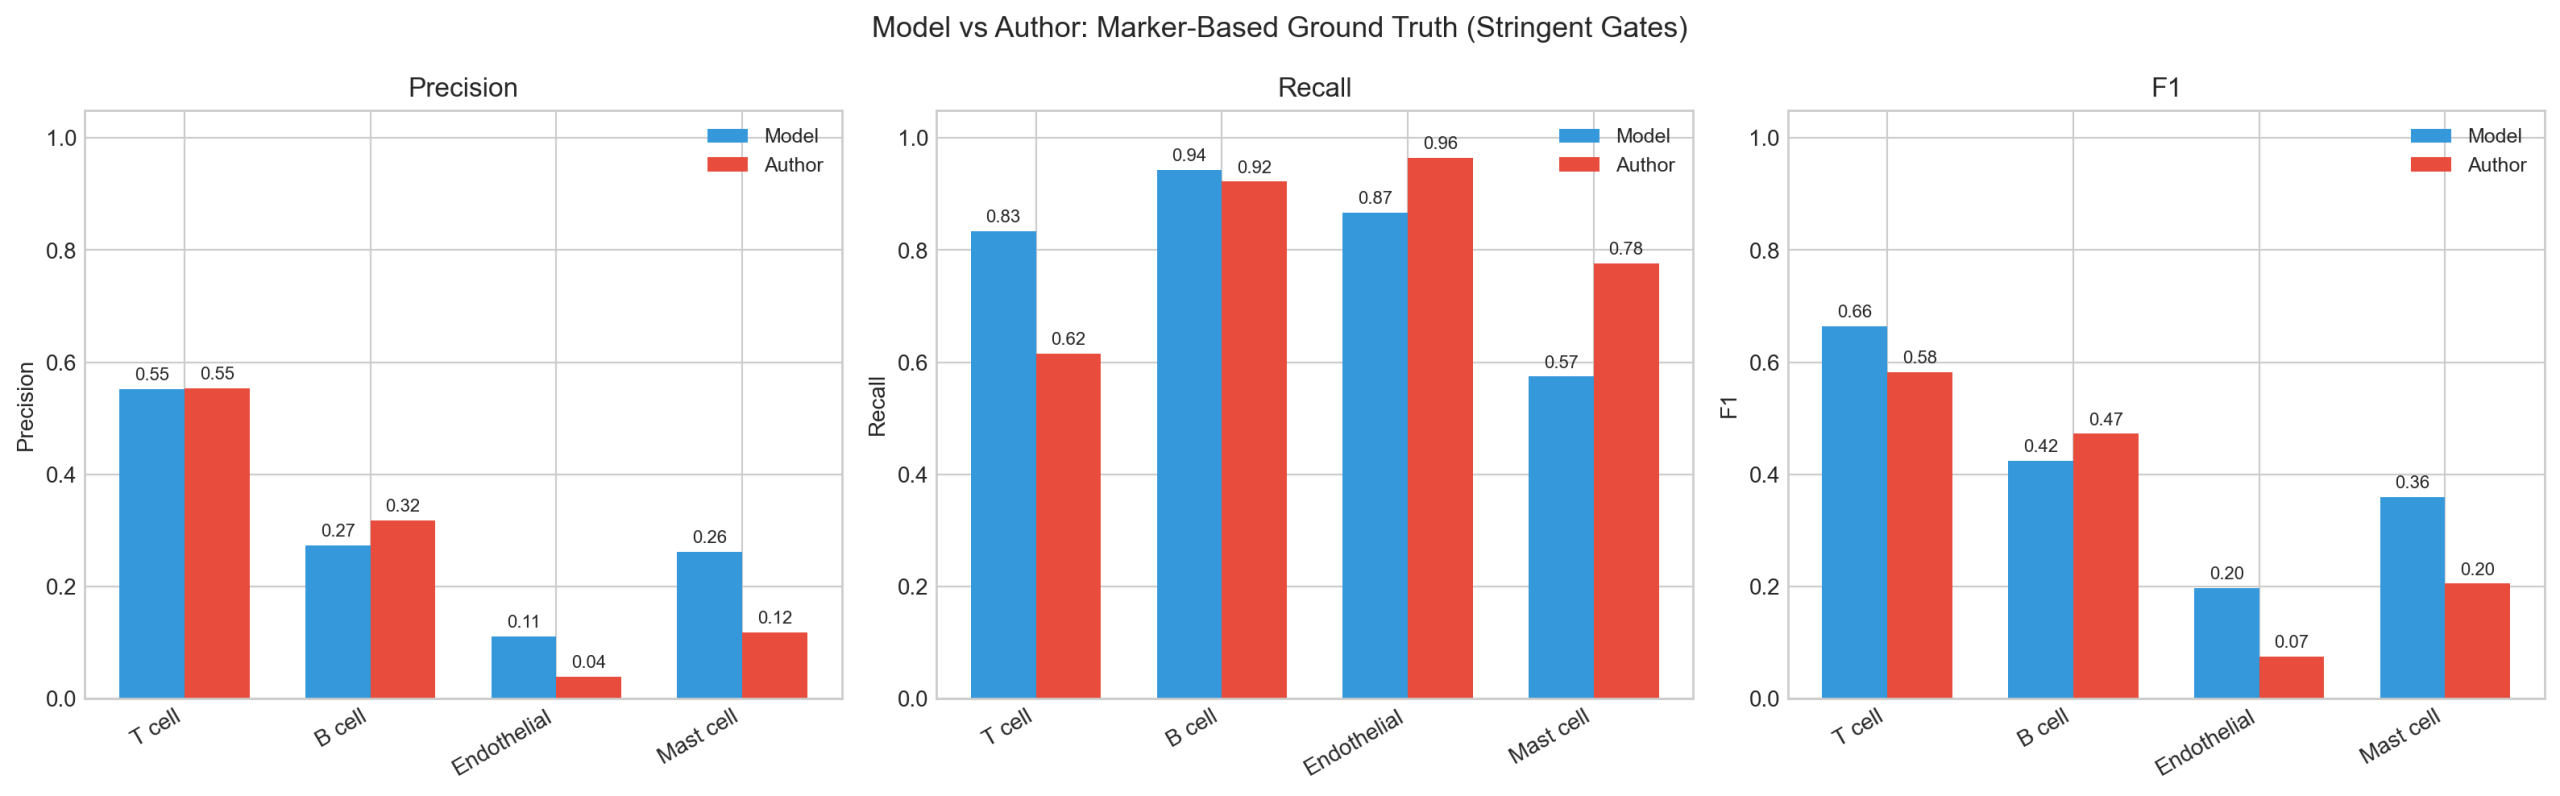
Stringent gates (with negative lineage exclusion):
| Cell Type | Gate | n marker+ | Model P | Model R | Model F1 | Author P | Author R | Author F1 | Δ F1 |
|---|---|---|---|---|---|---|---|---|---|
| T cell | CD3E+ / MS4A1−, CD79A−, PECAM1− | 189,506 | 0.551 | 0.834 | 0.664 | 0.553 | 0.616 | 0.583 | +0.081 |
| B cell | MS4A1+ AND CD79A+ / CD3E− | 47,801 | 0.274 | 0.943 | 0.424 | 0.317 | 0.922 | 0.472 | −0.048 |
| Endothelial | PECAM1+ AND CDH5+ / CD3E−, MS4A1− | 4,839 | 0.111 | 0.866 | 0.197 | 0.039 | 0.965 | 0.074 | +0.122 |
| Mast cell | KIT+ AND HPGDS+ / CD3E−, MS4A1− | 484 | 0.262 | 0.574 | 0.360 | 0.118 | 0.777 | 0.205 | +0.155 |
The model outperforms author annotations on 3 of 4 gated types (mean Δ F1 = +0.078). The model’s advantage is driven by higher recall on T cell (+0.22 absolute), endothelial, and mast cell — it identifies a larger fraction of cells that genuinely express canonical markers. The endothelial and mast cell results are particularly striking: the model is 2.7x and 1.8x better respectively.
B cell is the exception (author F1 0.472 vs model 0.424, Δ = −0.048). Both methods achieve high recall (>92%), so the gap is in precision (author 0.317 vs model 0.274). The model predicts 19 B cell subtypes in this dataset; many are legitimate B cells that don’t co-express MS4A1 and CD79A above the GMM threshold (e.g., germinal center B cells with variable MS4A1, transitional B cells). This inflates the model’s false-positive count relative to the author’s coarser labels.
Absolute F1 values are modest for all types — even T cell, the largest and best-defined population, reaches only 0.664. This reflects a fundamental limitation: marker gates in spatial transcriptomics are themselves vulnerable to the same segmentation artifacts documented in Sections 4–6. Two mechanisms corrupt the marker-gate “ground truth”:
Spatial artifacts bias marker methods towards incorrect labels
1. Marker transcripts leak to neighboring non-target cells. For example, MS4A1 and CD79A transcripts bleed from B cells into adjacent cells through segmentation overlap. The negative CD3E− gate catches T cells that pick up these markers, but non-T lineages pass through undetected. Of the 2,731 cells that pass the B cell gate but the model calls non-B, the top predictions are dendritic cell (576), CD1c+ myeloid DC (439), malignant cell (375), and plasma cell (215). These cells sit at the periphery of B cell zones (median 30% vs 55% B cell neighbors), exactly where bleed-through is strongest. The marker gate misclassifies them as B cells; the model, using the full transcriptome, correctly identifies them as non-B — and is penalized for it.
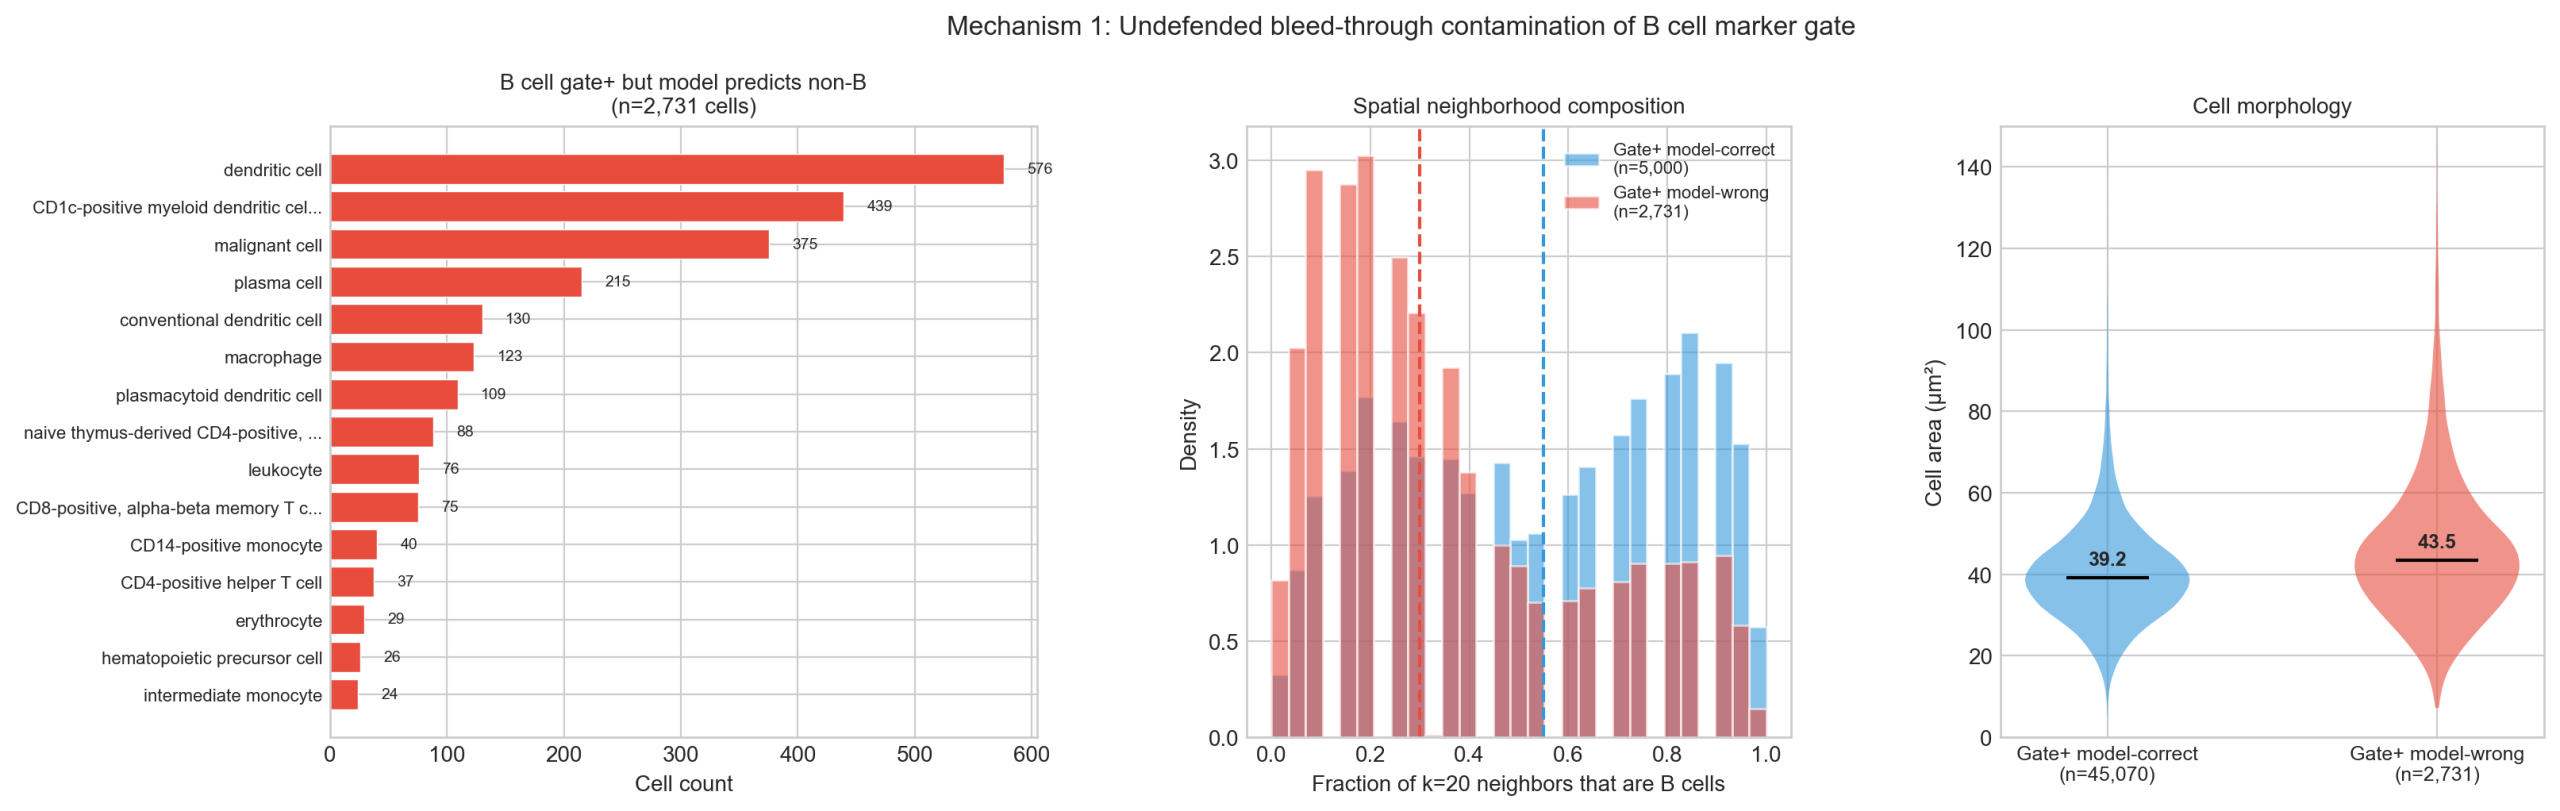
2. Transcript depletion excludes real target cells. For example, of the 164,778 cells the model predicts as B cell types, only 45,070 (27%) pass the stringent marker gate. The 119,708 that fail are 16% smaller (median 33 vs 39 μm²), have 29% fewer transcripts (247 vs 347), and 25% fewer genes detected (211 vs 283). These are real B cells in dense regions whose transcript counts have been depleted by segmentation boundary effects, causing them to fall below the MS4A1+/CD79A+ threshold despite being biologically B cells. This is consistent with the ~14% differential transcript depletion documented in Section 6.

Both mechanisms push F1 down relative to what the same gates would achieve in dissociated scRNA-seq. The first mechanism specifically biases the comparison against a model that correctly sees through spatial contamination.
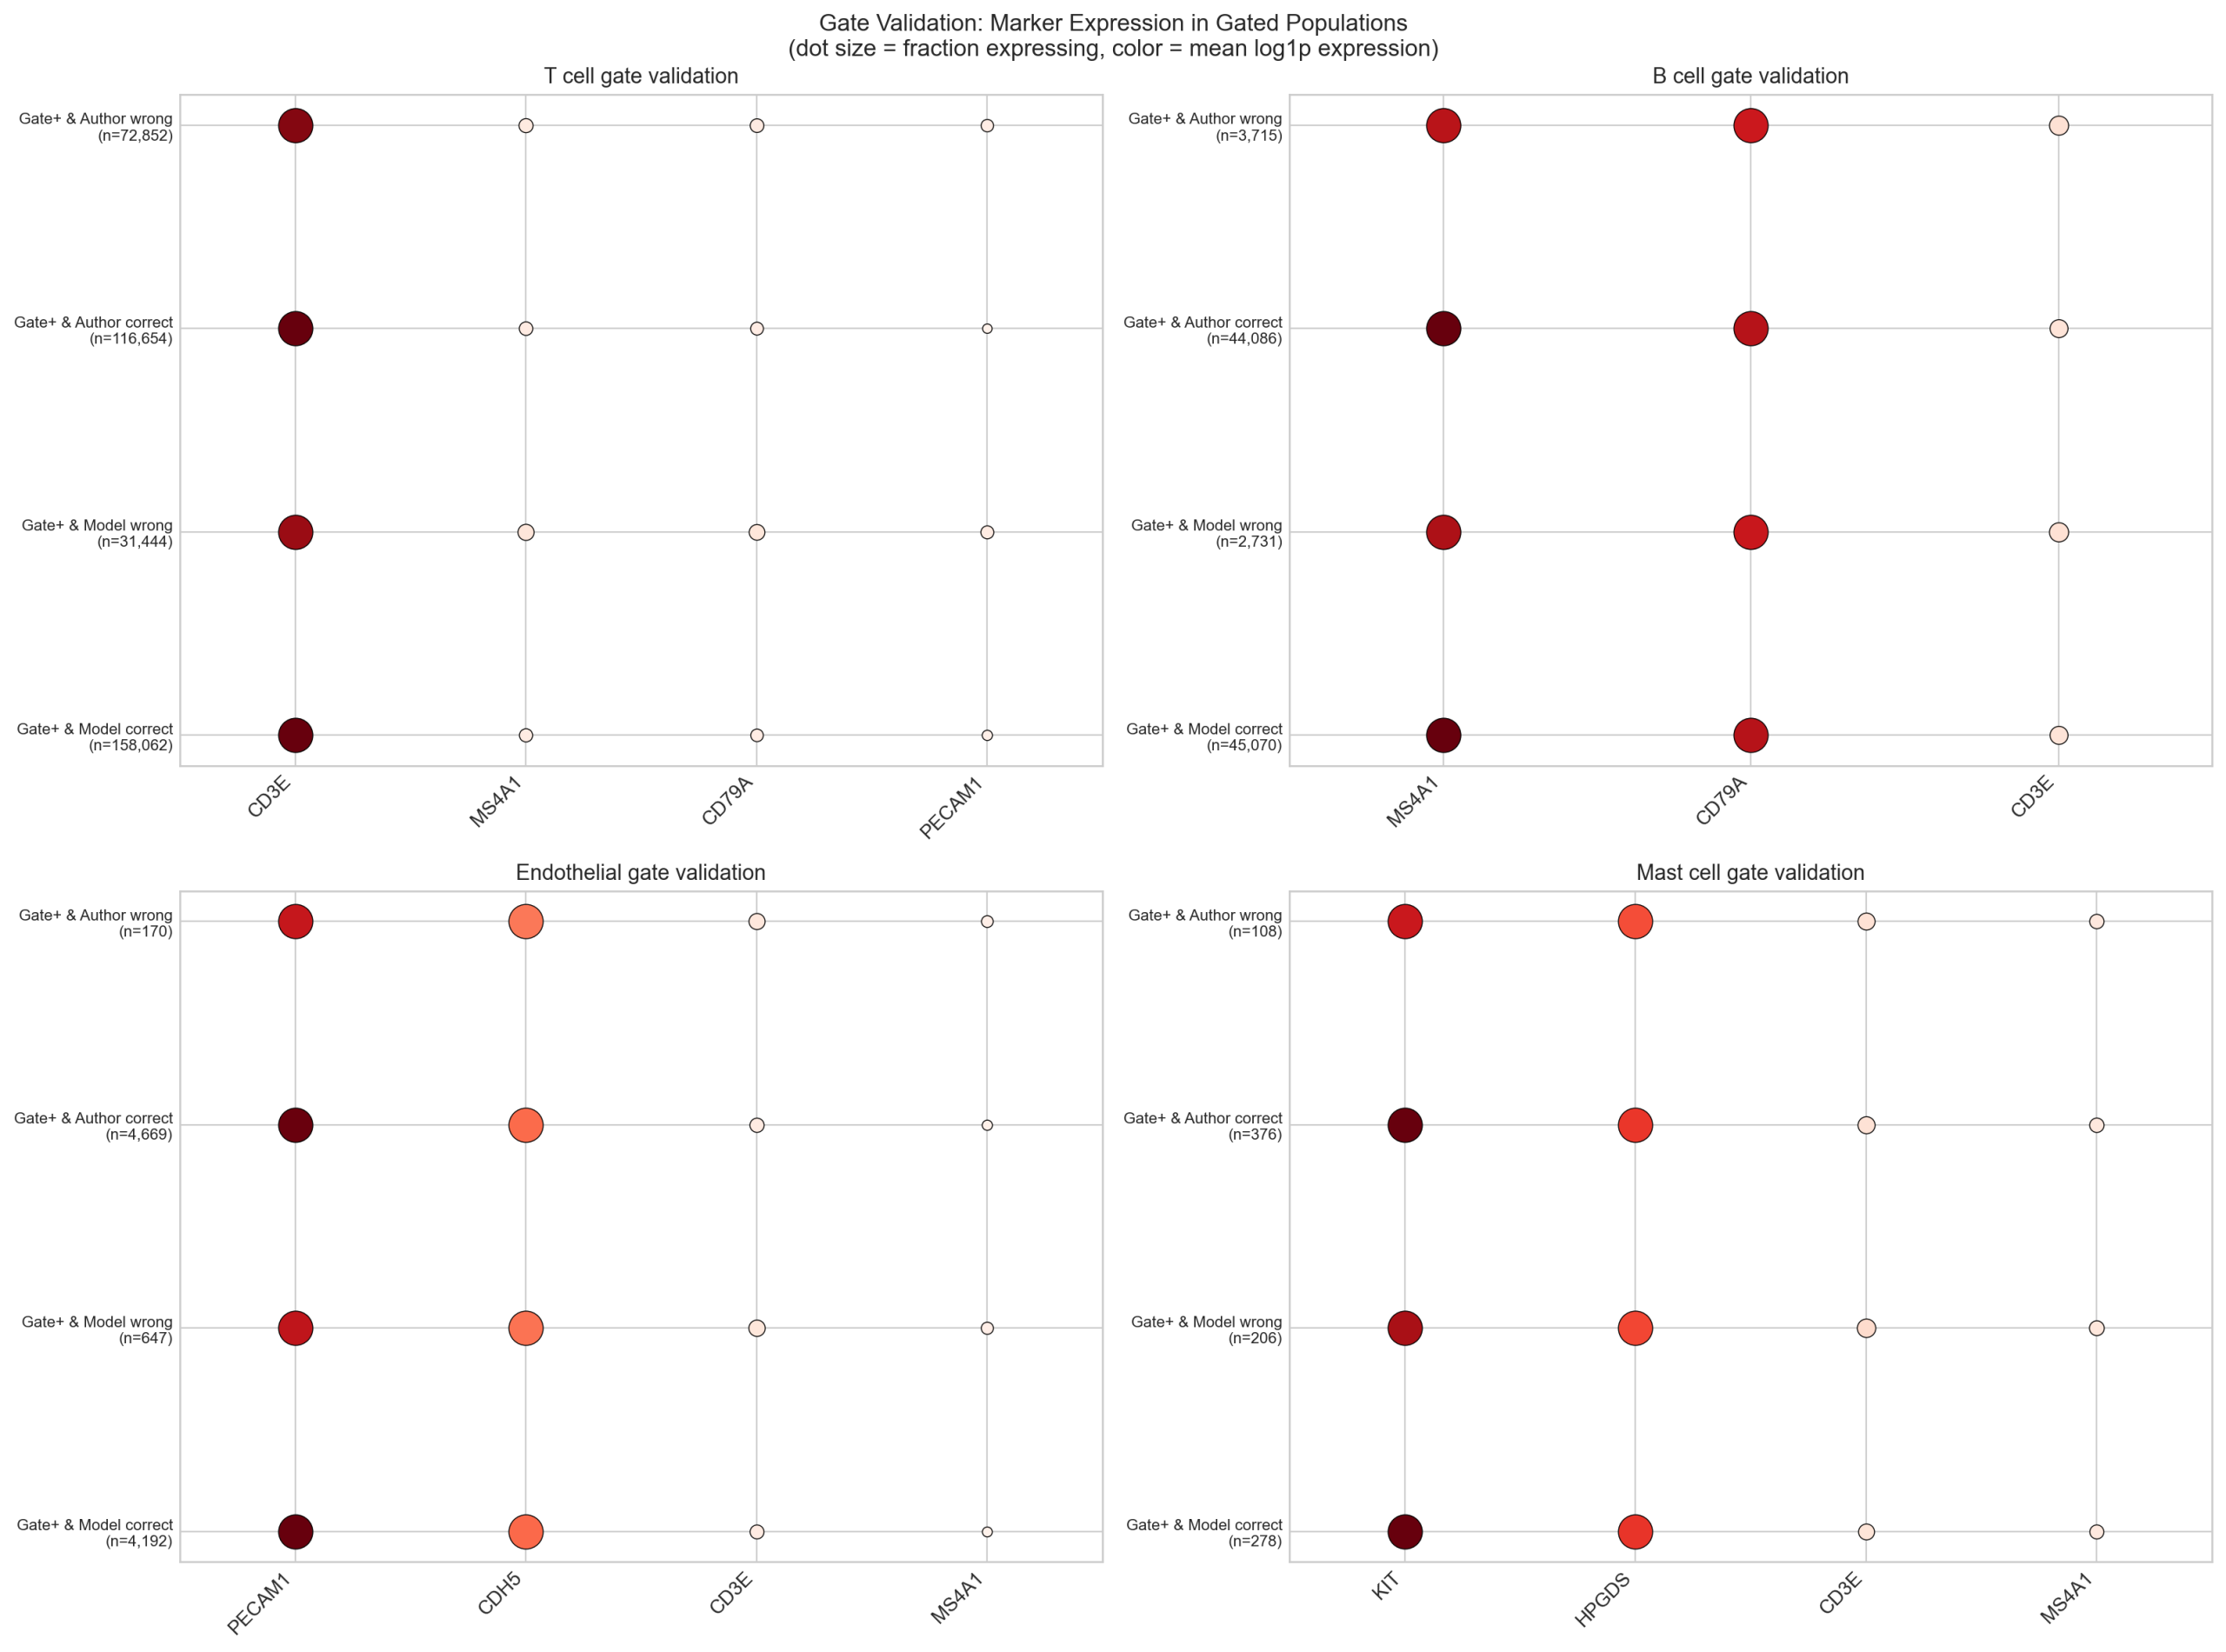
1.4 Gate Validation
Despite these limitations of marker gating, marker expression dotplots confirm that gated populations are biologically coherent: cells passing each gate express the expected positive markers at high levels and the exclusion markers at background levels.
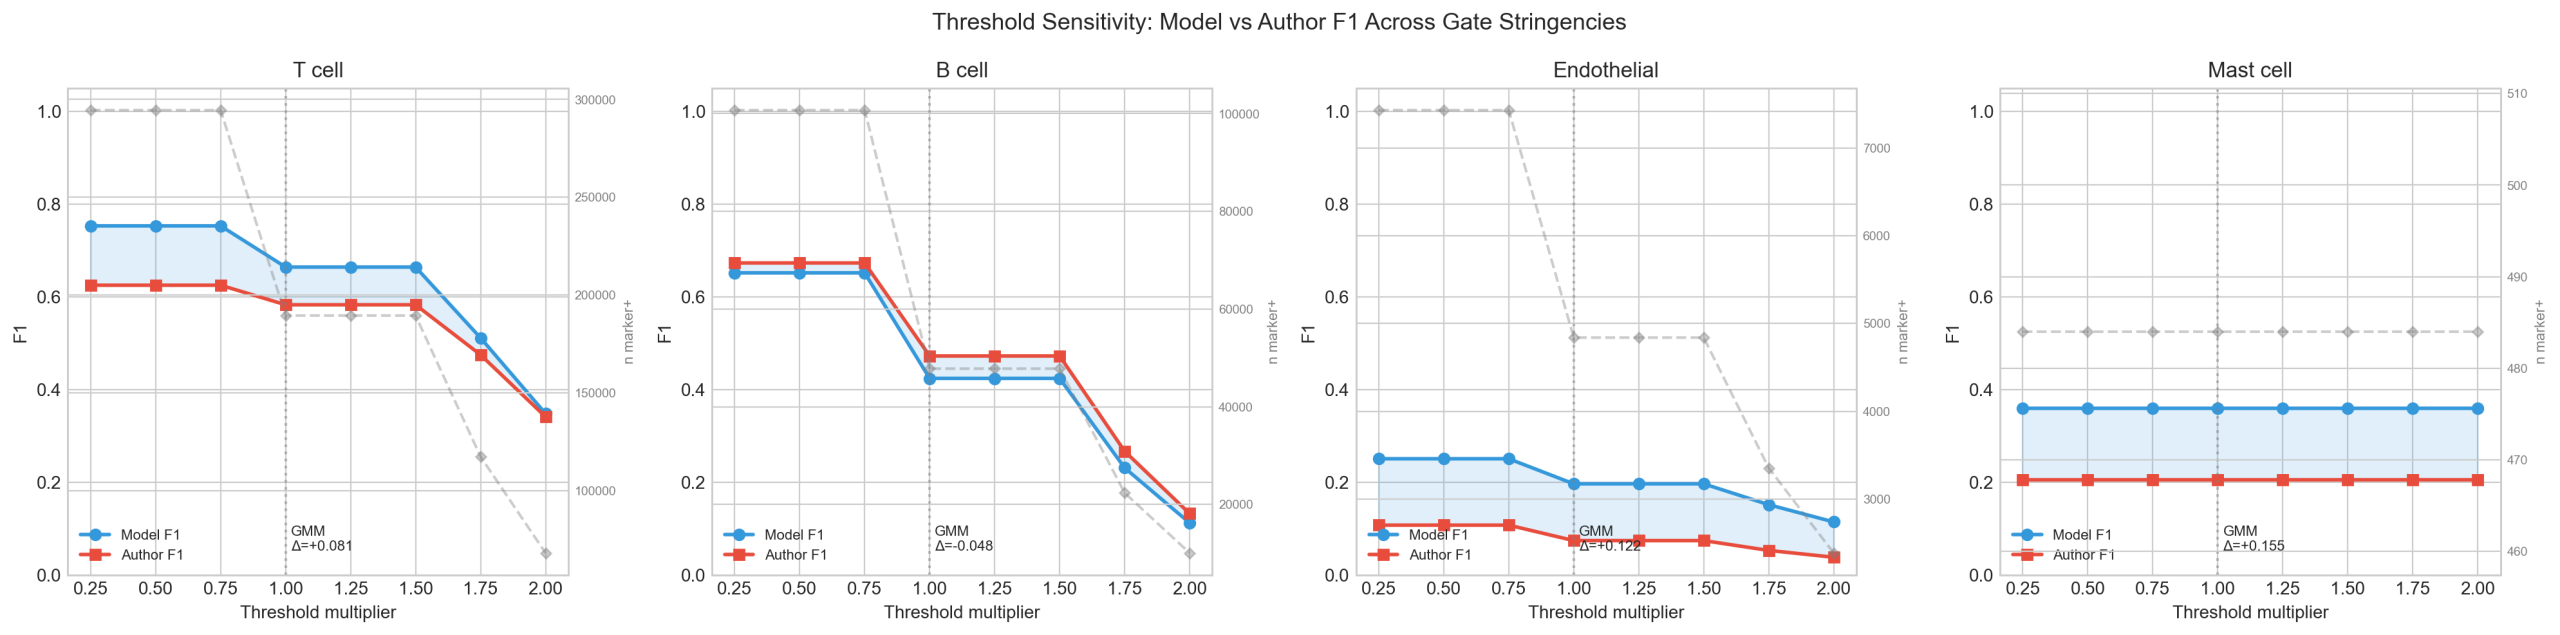
1.5 Sensitivity Analysis
The model-vs-author F1 delta is stable across a range of threshold stringencies (0.25x to 2.0x the GMM threshold), confirming that the results are not artifacts of a particular threshold choice.
2. Accuracy Before and After Corrections
We evaluate MiraTyper predictions against the vendor’s 28 author-labeled types using hierarchical F1 (h-F1), which gives partial credit when the model predicts a descendant or ancestor of the author label in the Cell Ontology. We then systematically correct validated author annotation errors (Sections 4–5) for a single author annotation to measure how much of the raw gap is attributable to author mistakes rather than model failures. The confusion matrices at the end of this section show the before/after picture.
2.1 Raw Performance
| Metric | Value |
|---|---|
| Hierarchical Precision | 0.713 |
| Hierarchical Recall | 0.821 |
| Hierarchical F1 | 0.763 |
| Mean per-cell h-F1 | 0.739 |
| Mean confidence | 0.291 |
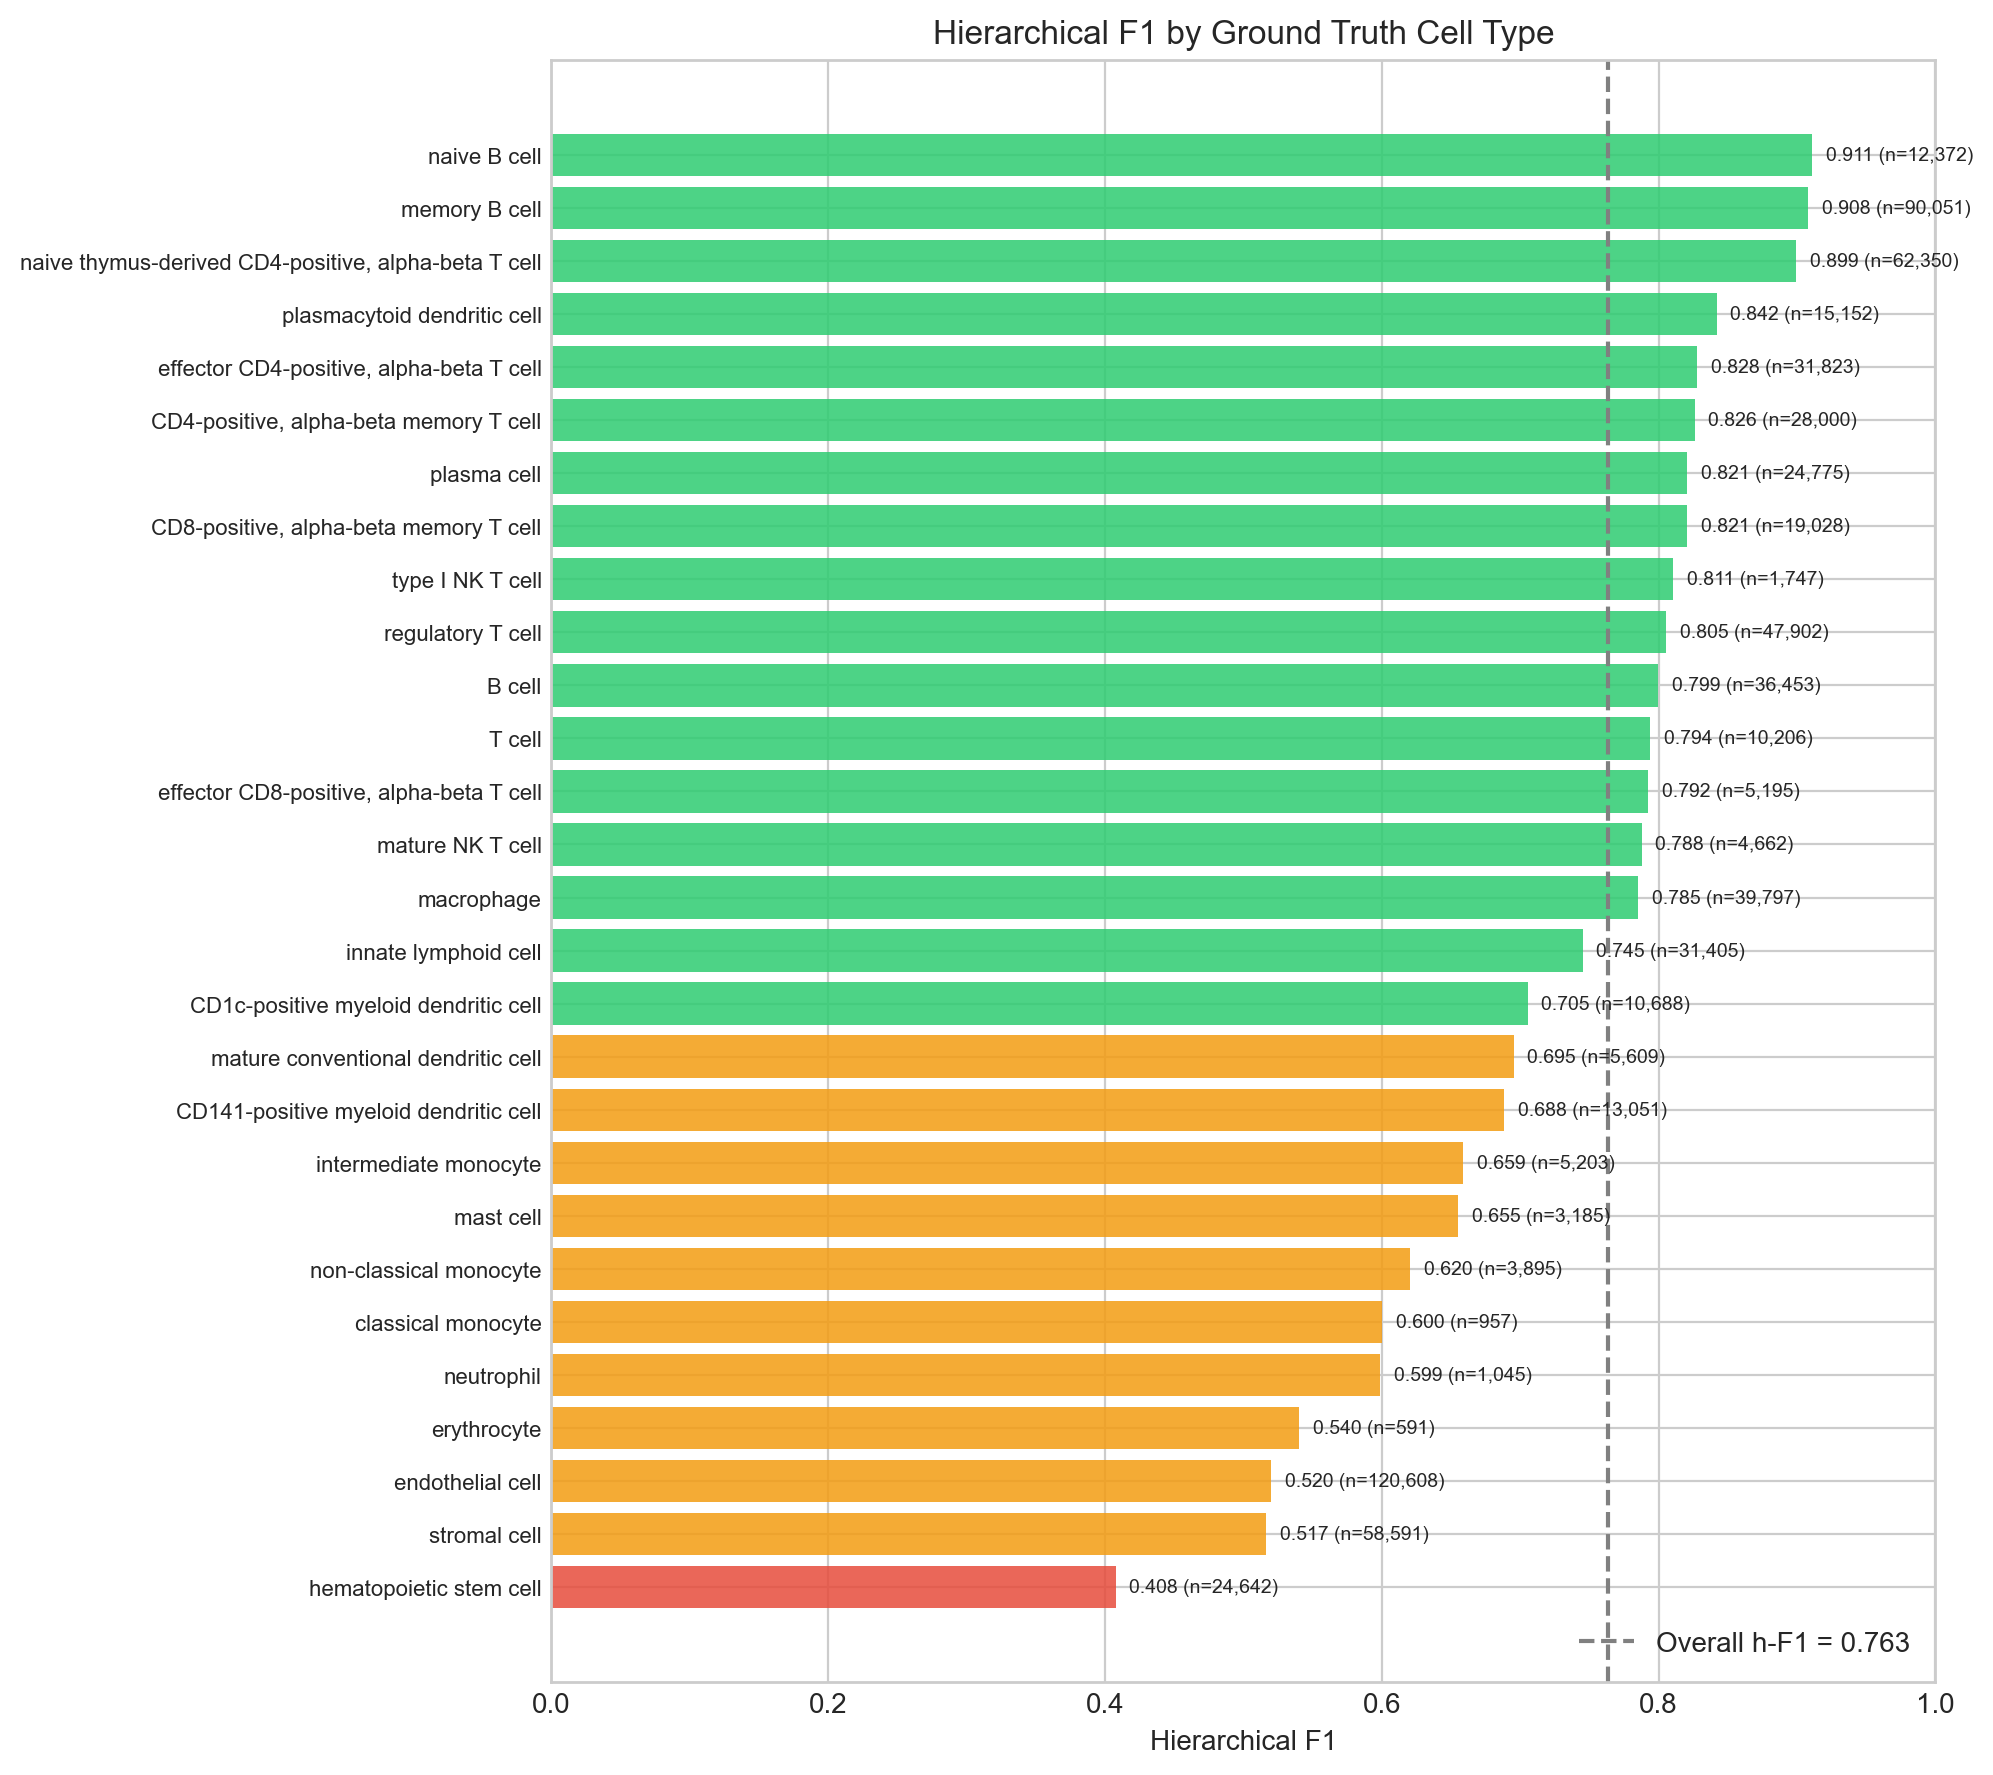
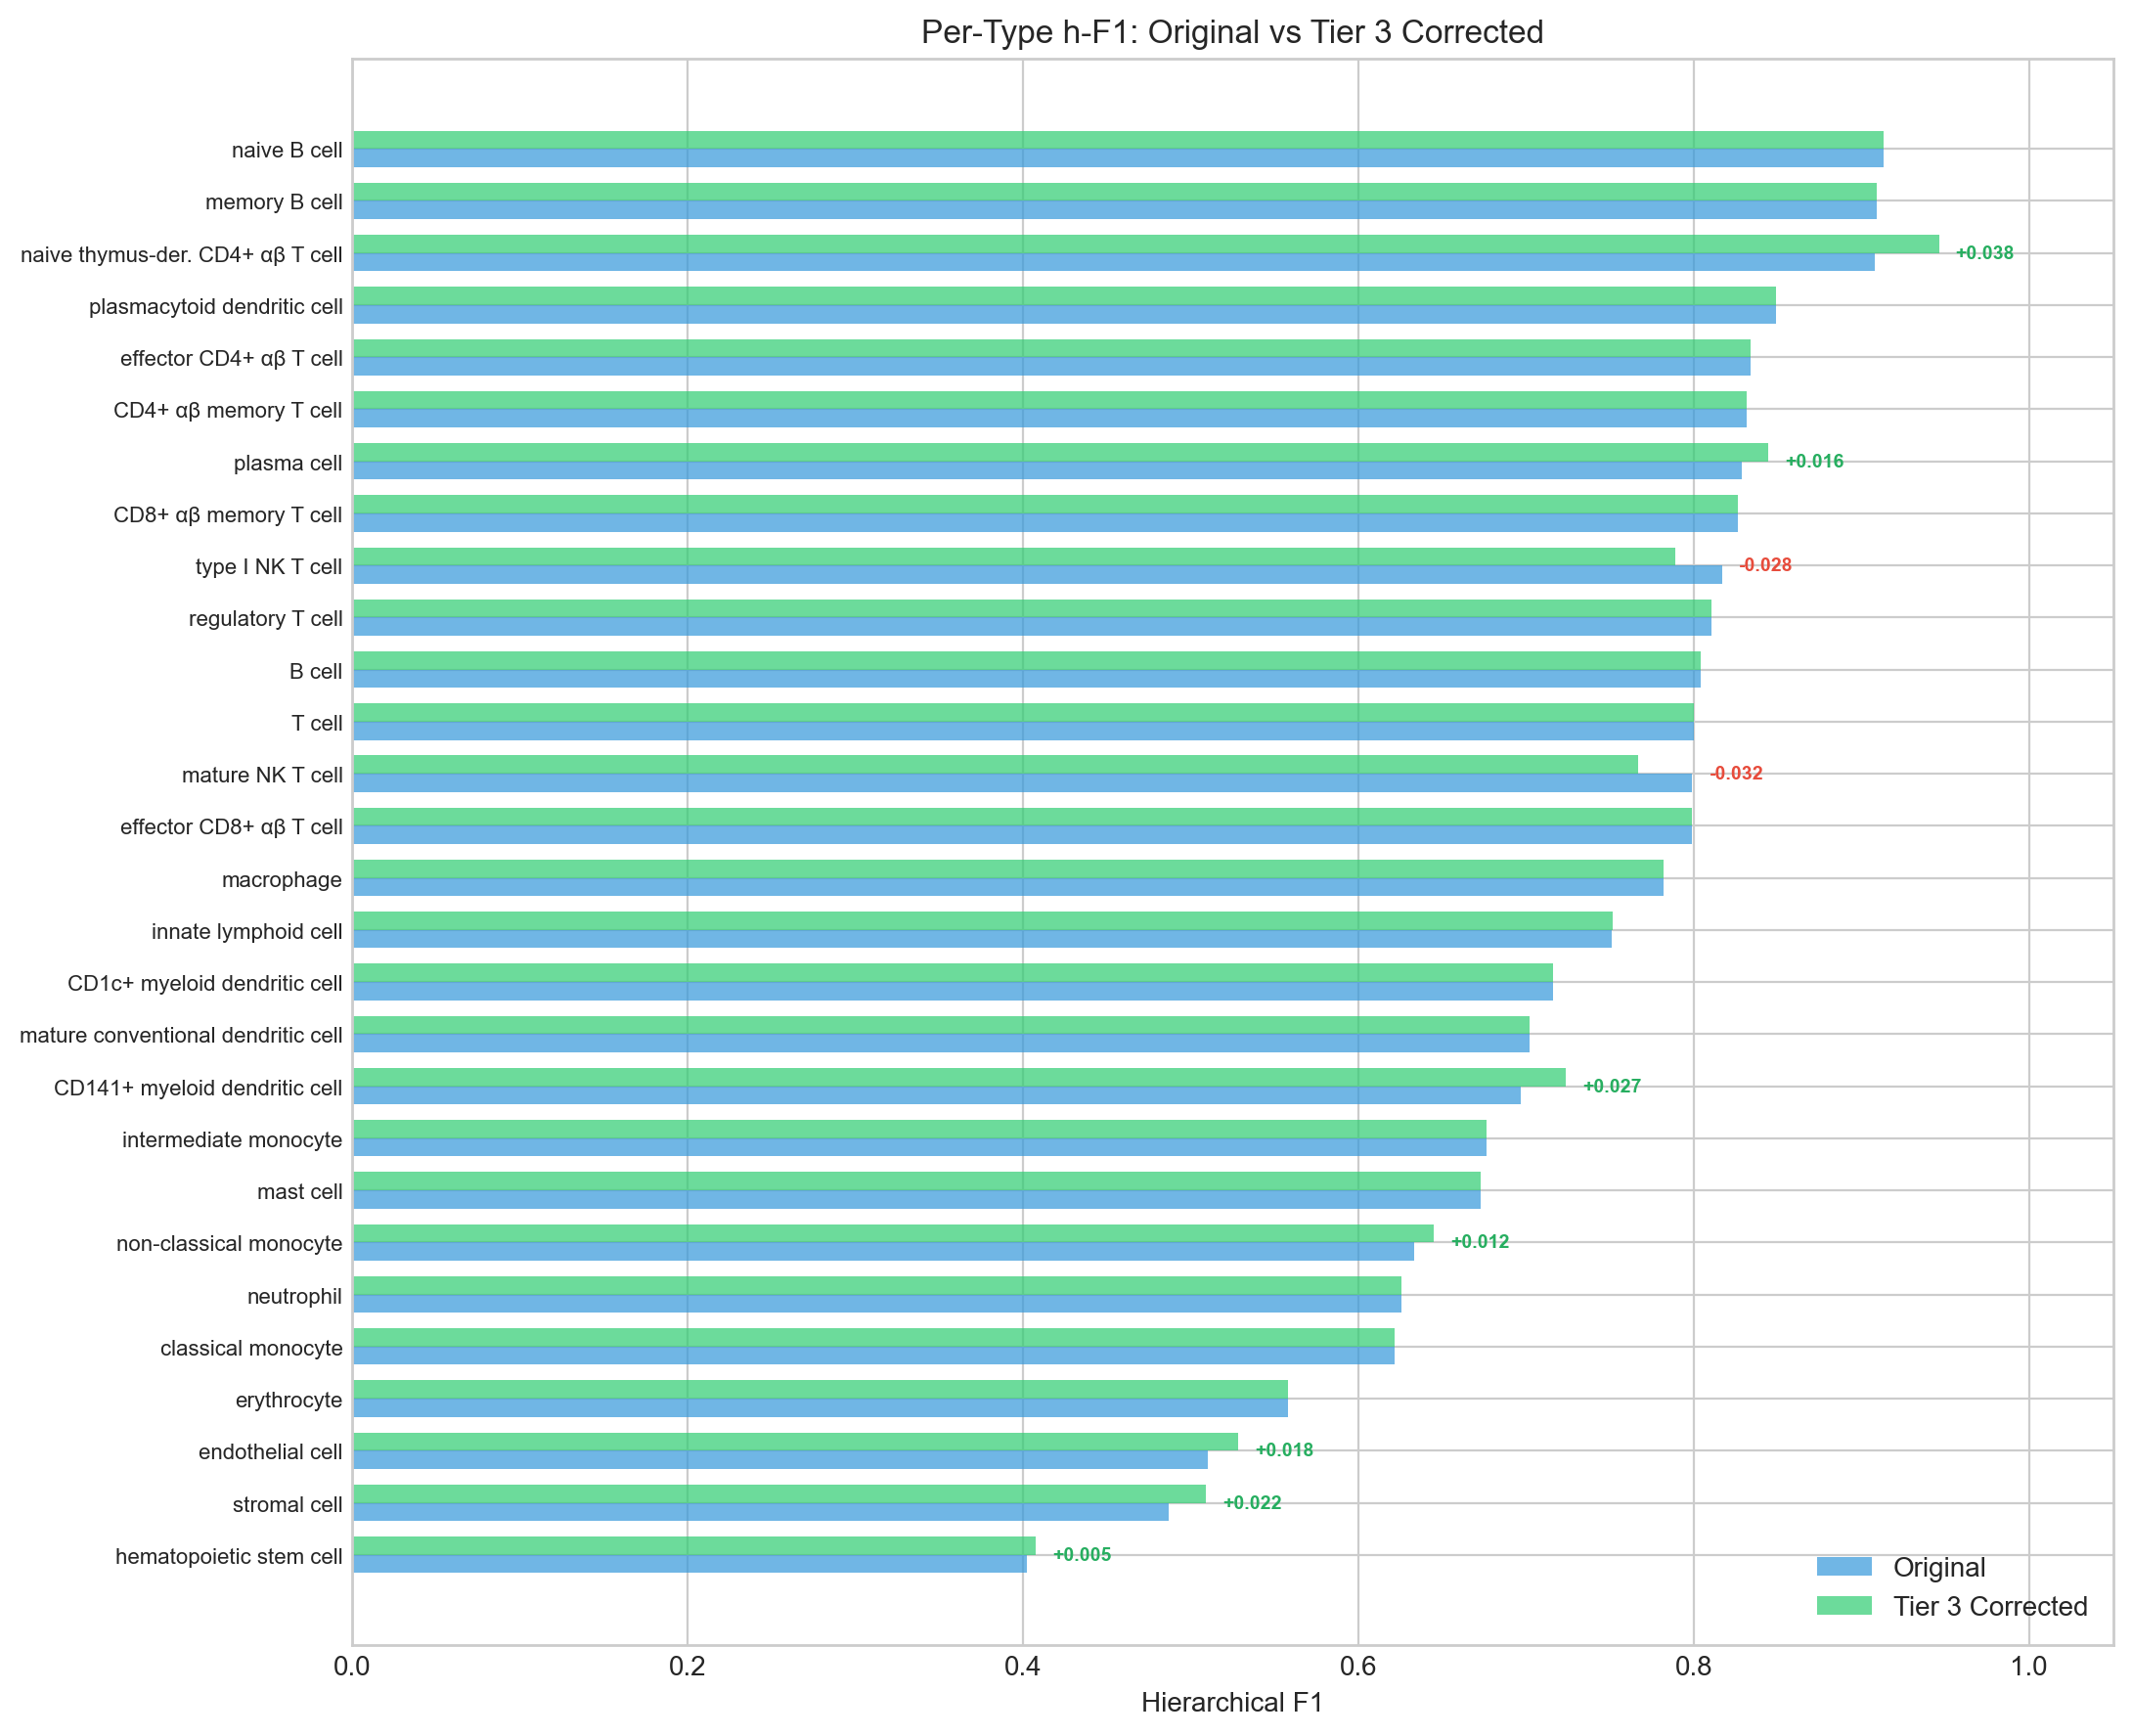
Best performers: Naive B (0.91), Memory B (0.91), Naive CD4 T (0.90) — types with distinctive transcriptional signatures. Worst performers: HSC (0.41), Stromal (0.52), Endothelial (0.52) — types where author annotations are demonstrably noisy (see Sections 4 and 5). The HSC result in particular reflects a complete Leiden clustering artifact rather than model failure (Section 5).
2.2 Corrected Performance
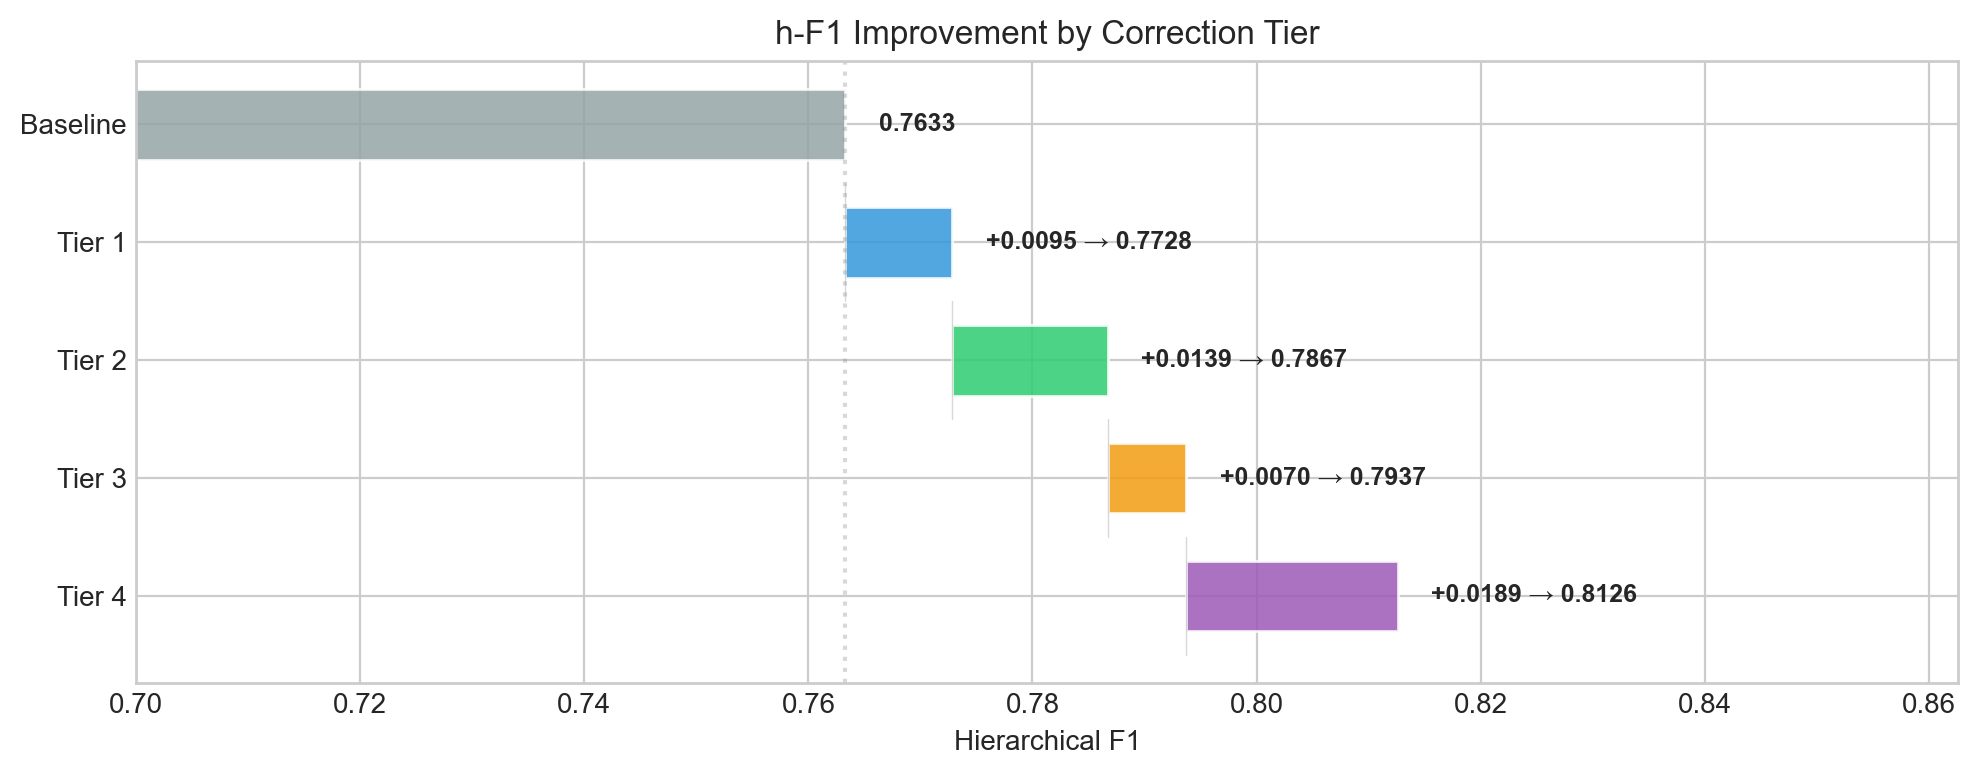
After systematically validating each author-prediction disagreement through marker expression, spatial neighbor analysis, and morphology (detailed in Sections 4-5), we applied tiered corrections to a single author label (naive thymus-derived CD4-positive, alpha-beta T cell):
| Tier | Corrections | Cells affected | h-F1 | Delta |
|---|---|---|---|---|
| Baseline | — | 0 | 0.763 | — |
| Tier 1 | Reclassify ILC→naive CD4, HSC→naive CD4, Plasma→plasma bleed, CD141 DC→DC | 16,572 | 0.773 | +1.0 |
| Tier 2 | Reclassify endothelial→naive CD4, stromal bleed, NKT→T cell subtypes | 18,557 | 0.787 | +1.4 |
| Tier 3 | Reclassify non-classical monocyte disagreements | 8,652 | 0.794 | +0.7 |
| Tier 4 | Collapse ontology equivalences (e.g., effector CD4 ≈ naive CD4 at this panel resolution) | 250K author + 40K pred | 0.813 | +1.9 |
Improvement due to single-label corrections: +5.0 percentage points (0.763 → 0.813), without changing any model predictions. All corrections are to the author labels, reflecting cases where the model was validated as correct.
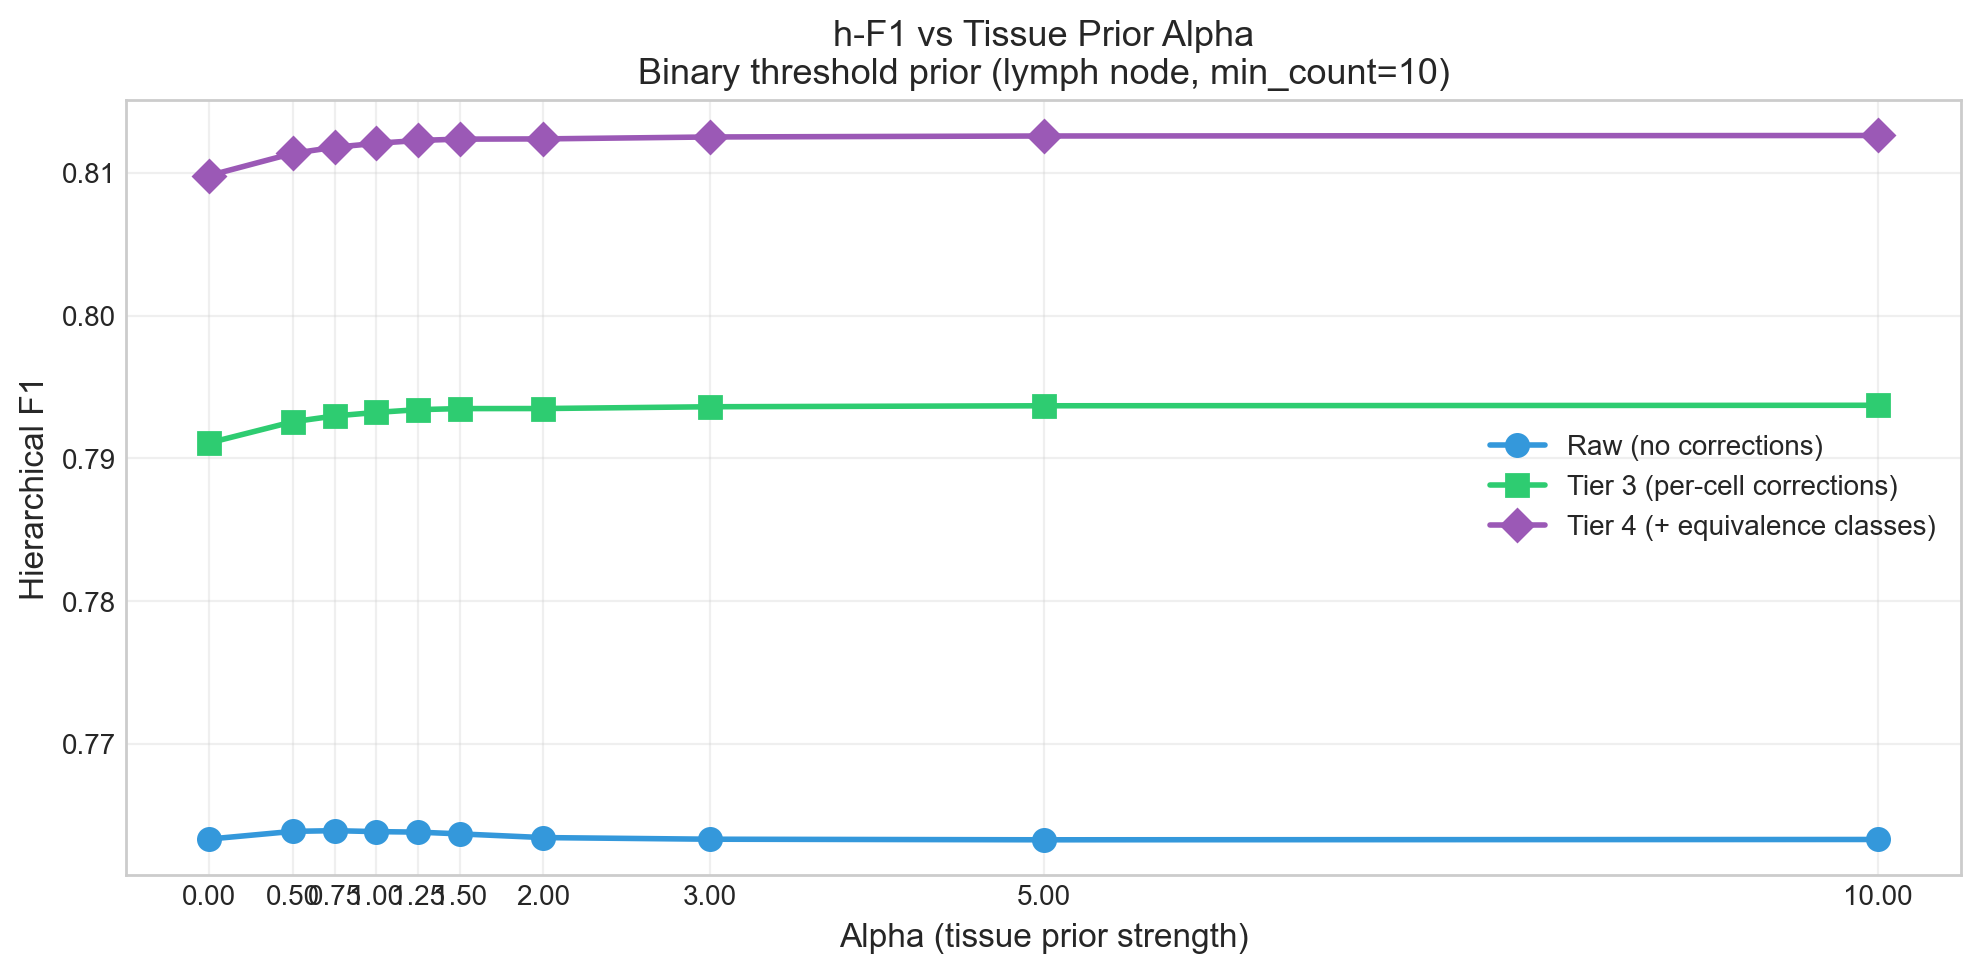
2.3 Performance Is Stable Across Tissue Prior Strength
The tissue prior (alpha) has minimal impact on raw h-F1 (0.763 at all alphas), but its primary effect is vocabulary filtering — reducing predicted types from 365 to 188 at alpha=10. After corrections, h-F1 is stable at 0.812-0.813 across all alpha values, confirming the corrections are robust.
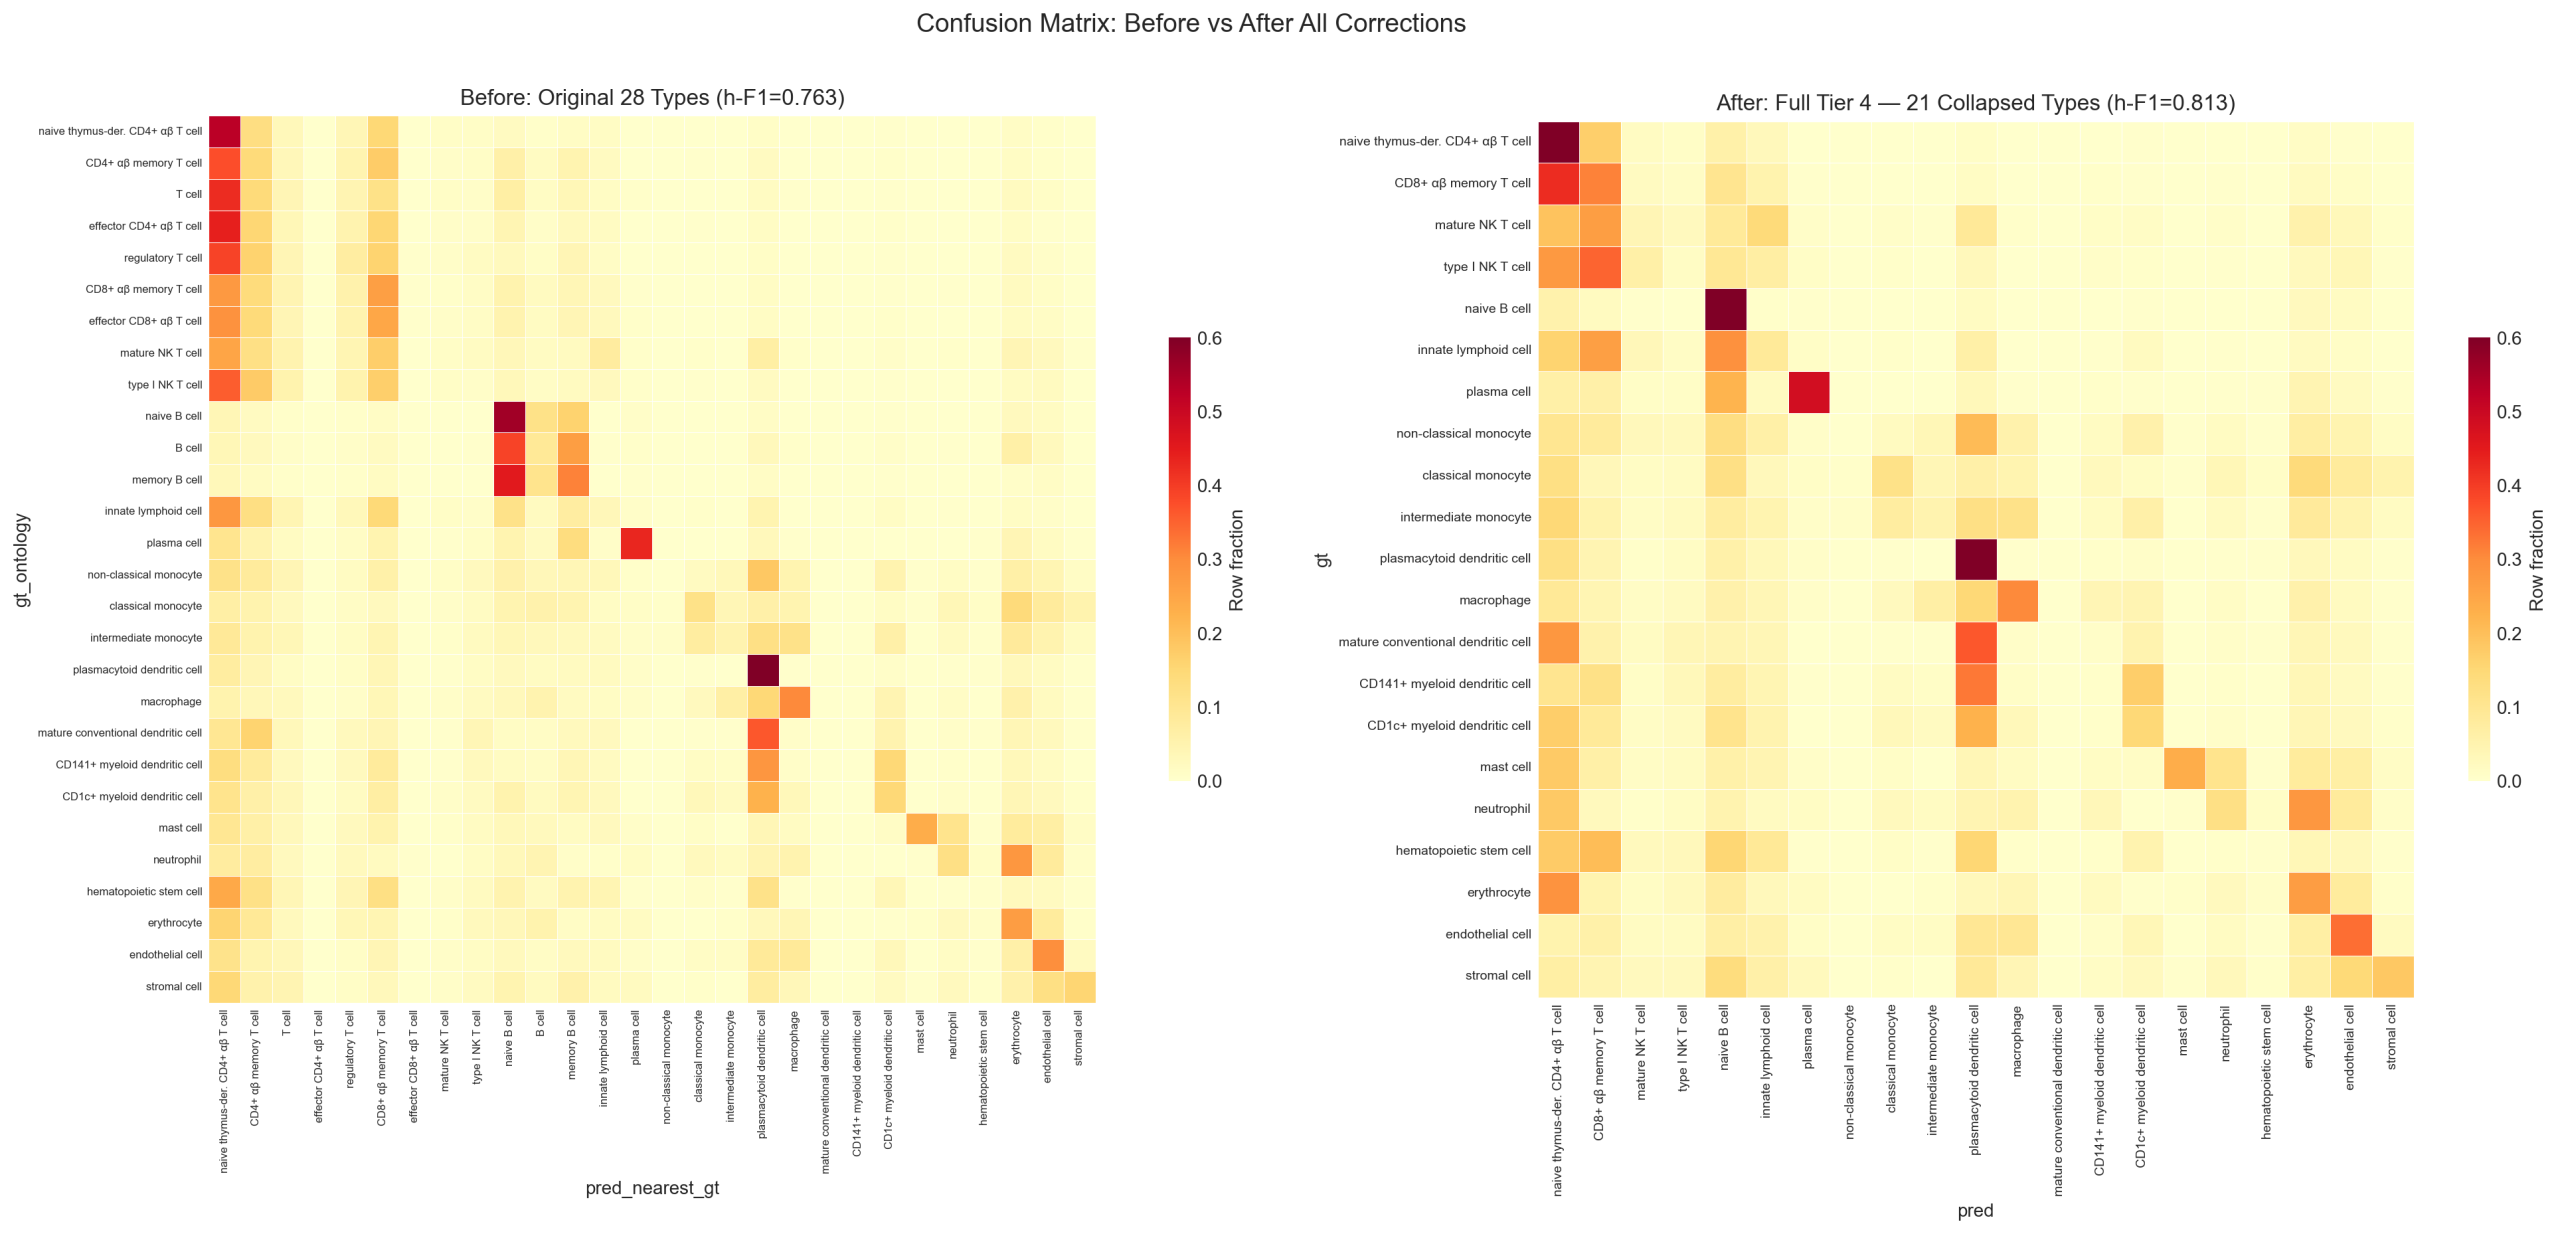
2.4 Confusion Matrix: Before and After Corrections
The left panel shows the original confusion matrix with all 28 author-labeled types. The right panel shows the same matrix after Tier 1-3 per-cell corrections and Tier 4 ontology equivalence collapse. The vertical line pattern (Section 5) is largely resolved, and the diagonal becomes dominant.
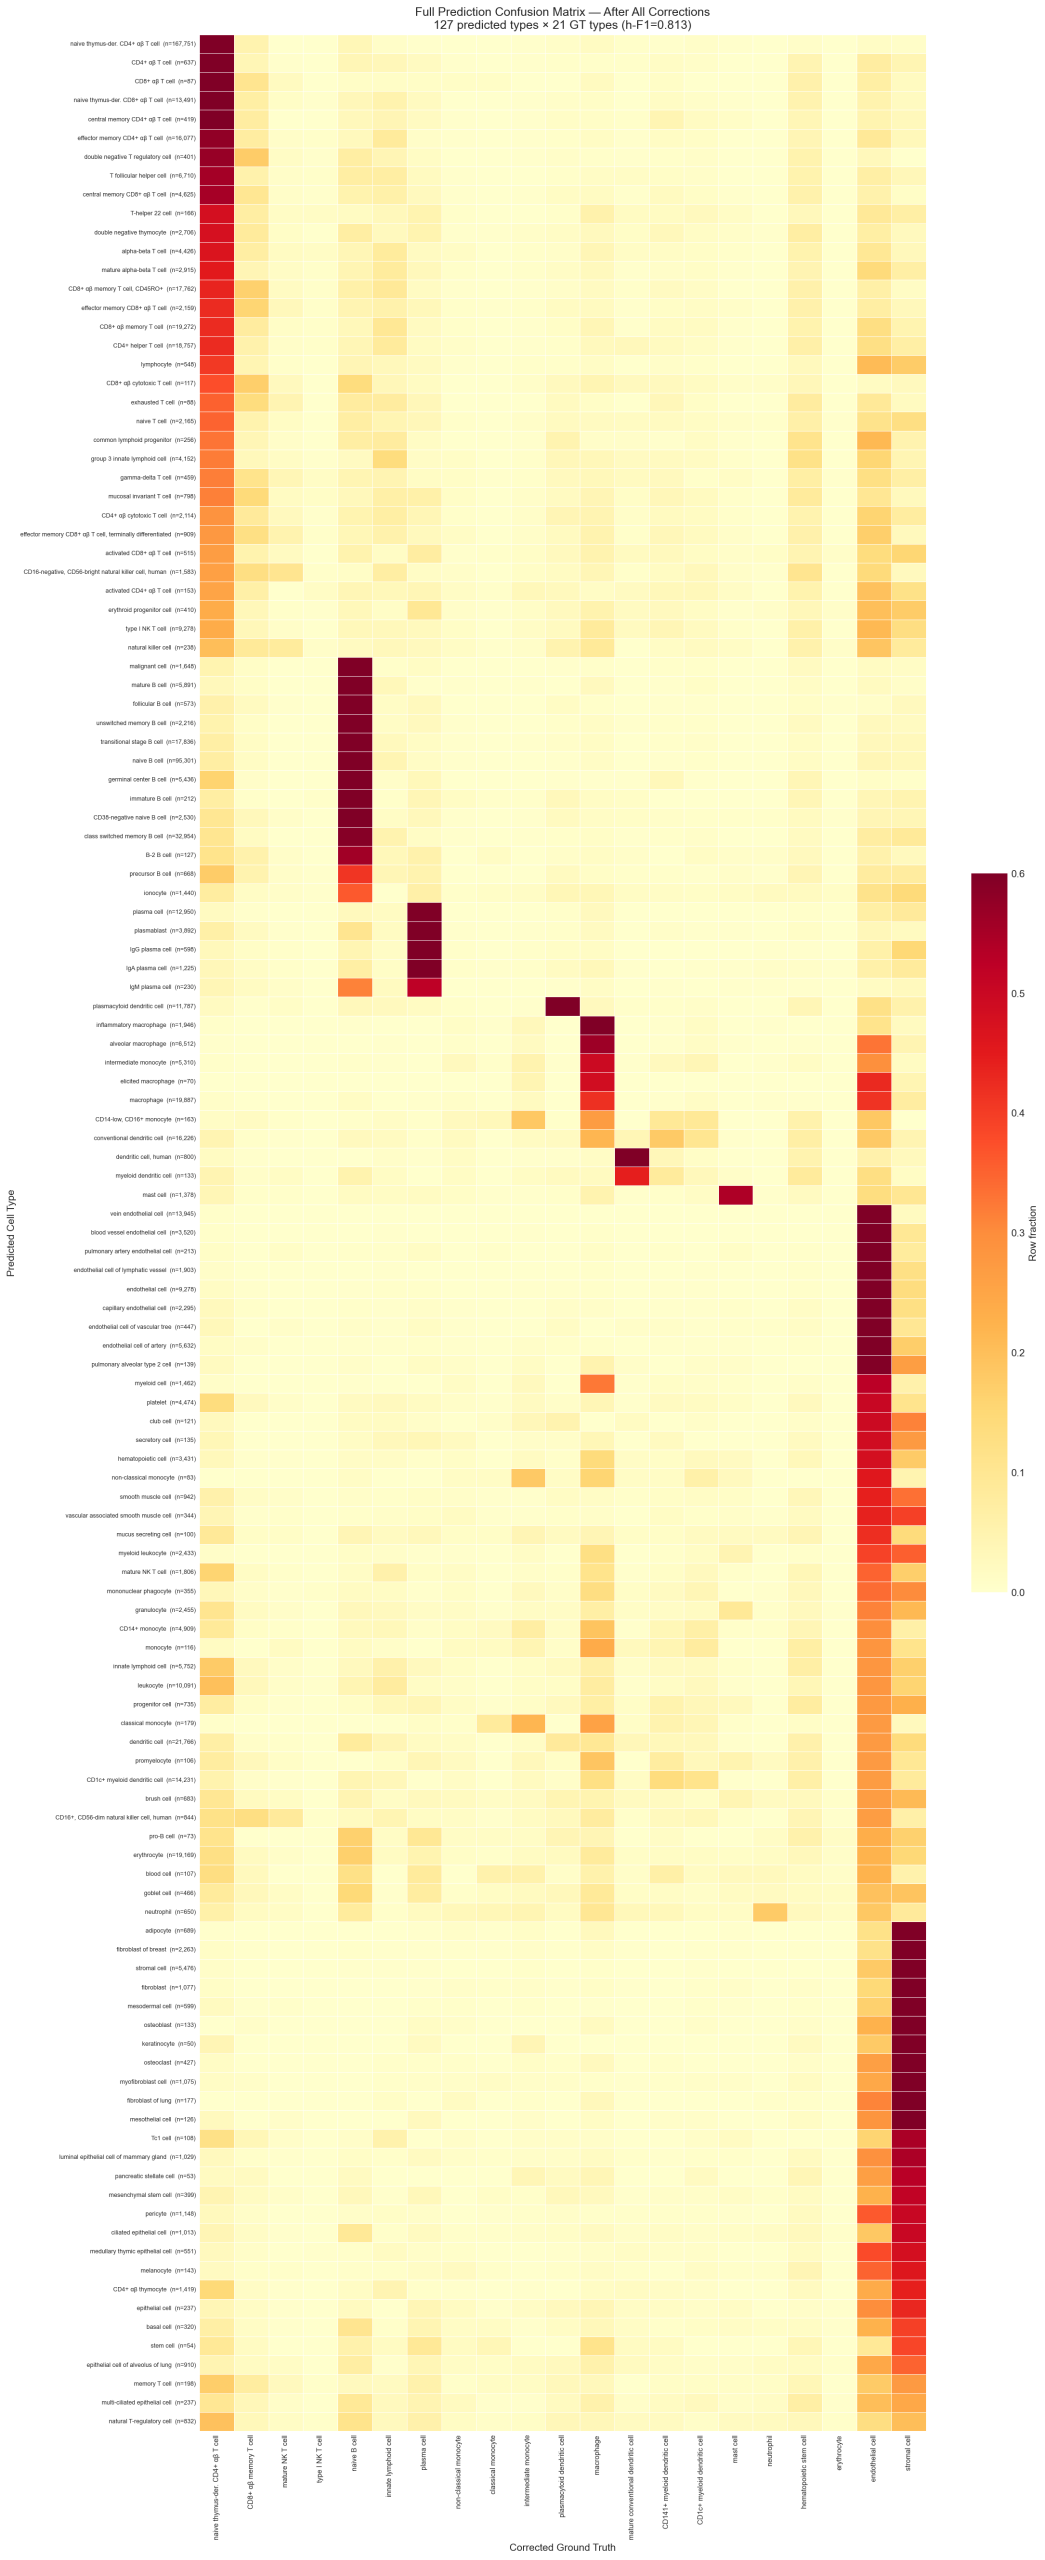
2.5 Full Prediction Confusion Matrix (Corrected)
After all corrections and tissue forcing (alpha=10), the full confusion matrix shows the model’s predictions mapped to corrected author labels. This reveals both the diagonal accuracy and the specific fine-grained subtypes the model uses within each broad author-labeled category.
3. Resolution Advantage
The model predicts from a vocabulary of 425 cell types — a 15x increase over the author labels’ 28 types. At alpha=0 (no tissue filtering), 365 unique types are used; at alpha=10, 188 types are used. This finer granularity reveals biological structure that coarse author labels obscure.
Examples of resolution gain:
| Author label (1 type) | Model predictions (multiple types) |
|---|---|
| B Cell | naive B cell, transitional stage B cell, mature B cell, class switched memory B cell, germinal center B cell, B-1 B cell |
| Memory B Cell | class switched memory B cell, memory B cell, IgG memory B cell |
| Endothelial Cell | vein endothelial cell, endothelial tip cell, endothelial cell of artery, capillary endothelial cell |
| Macrophage | macrophage, alveolar macrophage, Kupffer cell |
| Regulatory T Cell | regulatory T cell, effector memory CD4+ T cell, T follicular helper cell |
The model’s top 30 predicted types account for ~75% of all cells. Beyond the top types, a long tail of specific subtypes captures the heterogeneity within each broad author-labeled category.
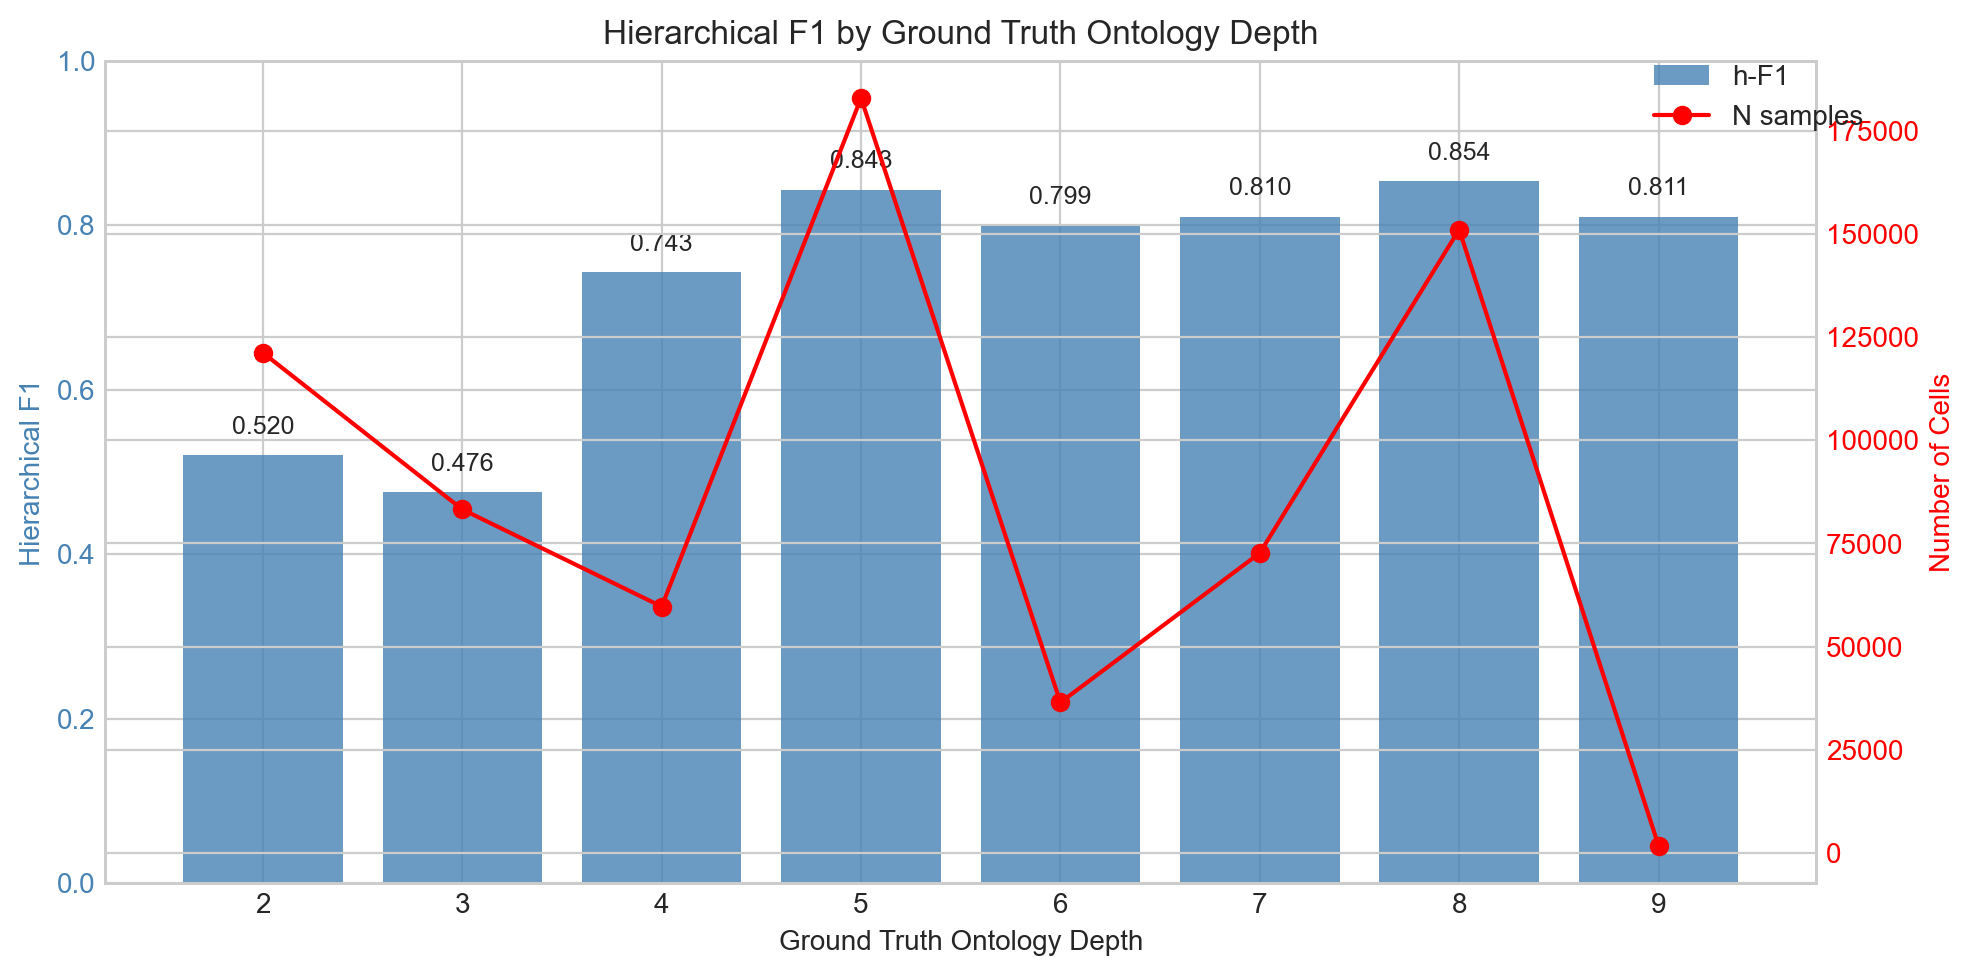
Performance varies substantially by author label ontology depth. Broad types at depth 2-3 (endothelial, stromal, HSC) score worst because the model predicts specific subtypes while the author labels are coarse — a resolution mismatch, not an accuracy failure. Deep types at depth 7-9 (regulatory T, plasma, type I NK T) score well because the model and author labels agree at the leaf level.
4. Error Attribution: Author Errors vs Model Errors
4.1 Overview
We identify four distinct mechanisms that explain author-prediction disagreements. Three are errors in the vendor’s Leiden-based annotation pipeline; only one represents the model being affected by a technical artifact.
| Mechanism | Source | Cells affected | Nature |
|---|---|---|---|
| Author misannotation (cell cycle/contamination signal) | Author error | ~57K | Leiden clusters on cell cycle variance, not lineage |
| Segmentation bleed-through | Author error (spatial) | ~14.5K | Small cells near unlike neighbors pick up foreign transcripts |
| Noisy interfaces | Author error (spatial) | ~7K | Cells at intimate cell-cell contacts express intermediate profiles |
| Segmentation-induced malignant | Model artifact (spatial) | 1.4K | Dense B cell regions lose transcripts to neighbors |
Spatial/segmentation effects dominate. Of the ~80K disagreement cells, approximately 23K are attributable to spatial artifacts (bleed-through, noisy interfaces, and malignant predictions). The remaining ~57K are author misannotations caused by the HVG-PCA-Leiden pipeline’s sensitivity to cell cycle and contamination signal.
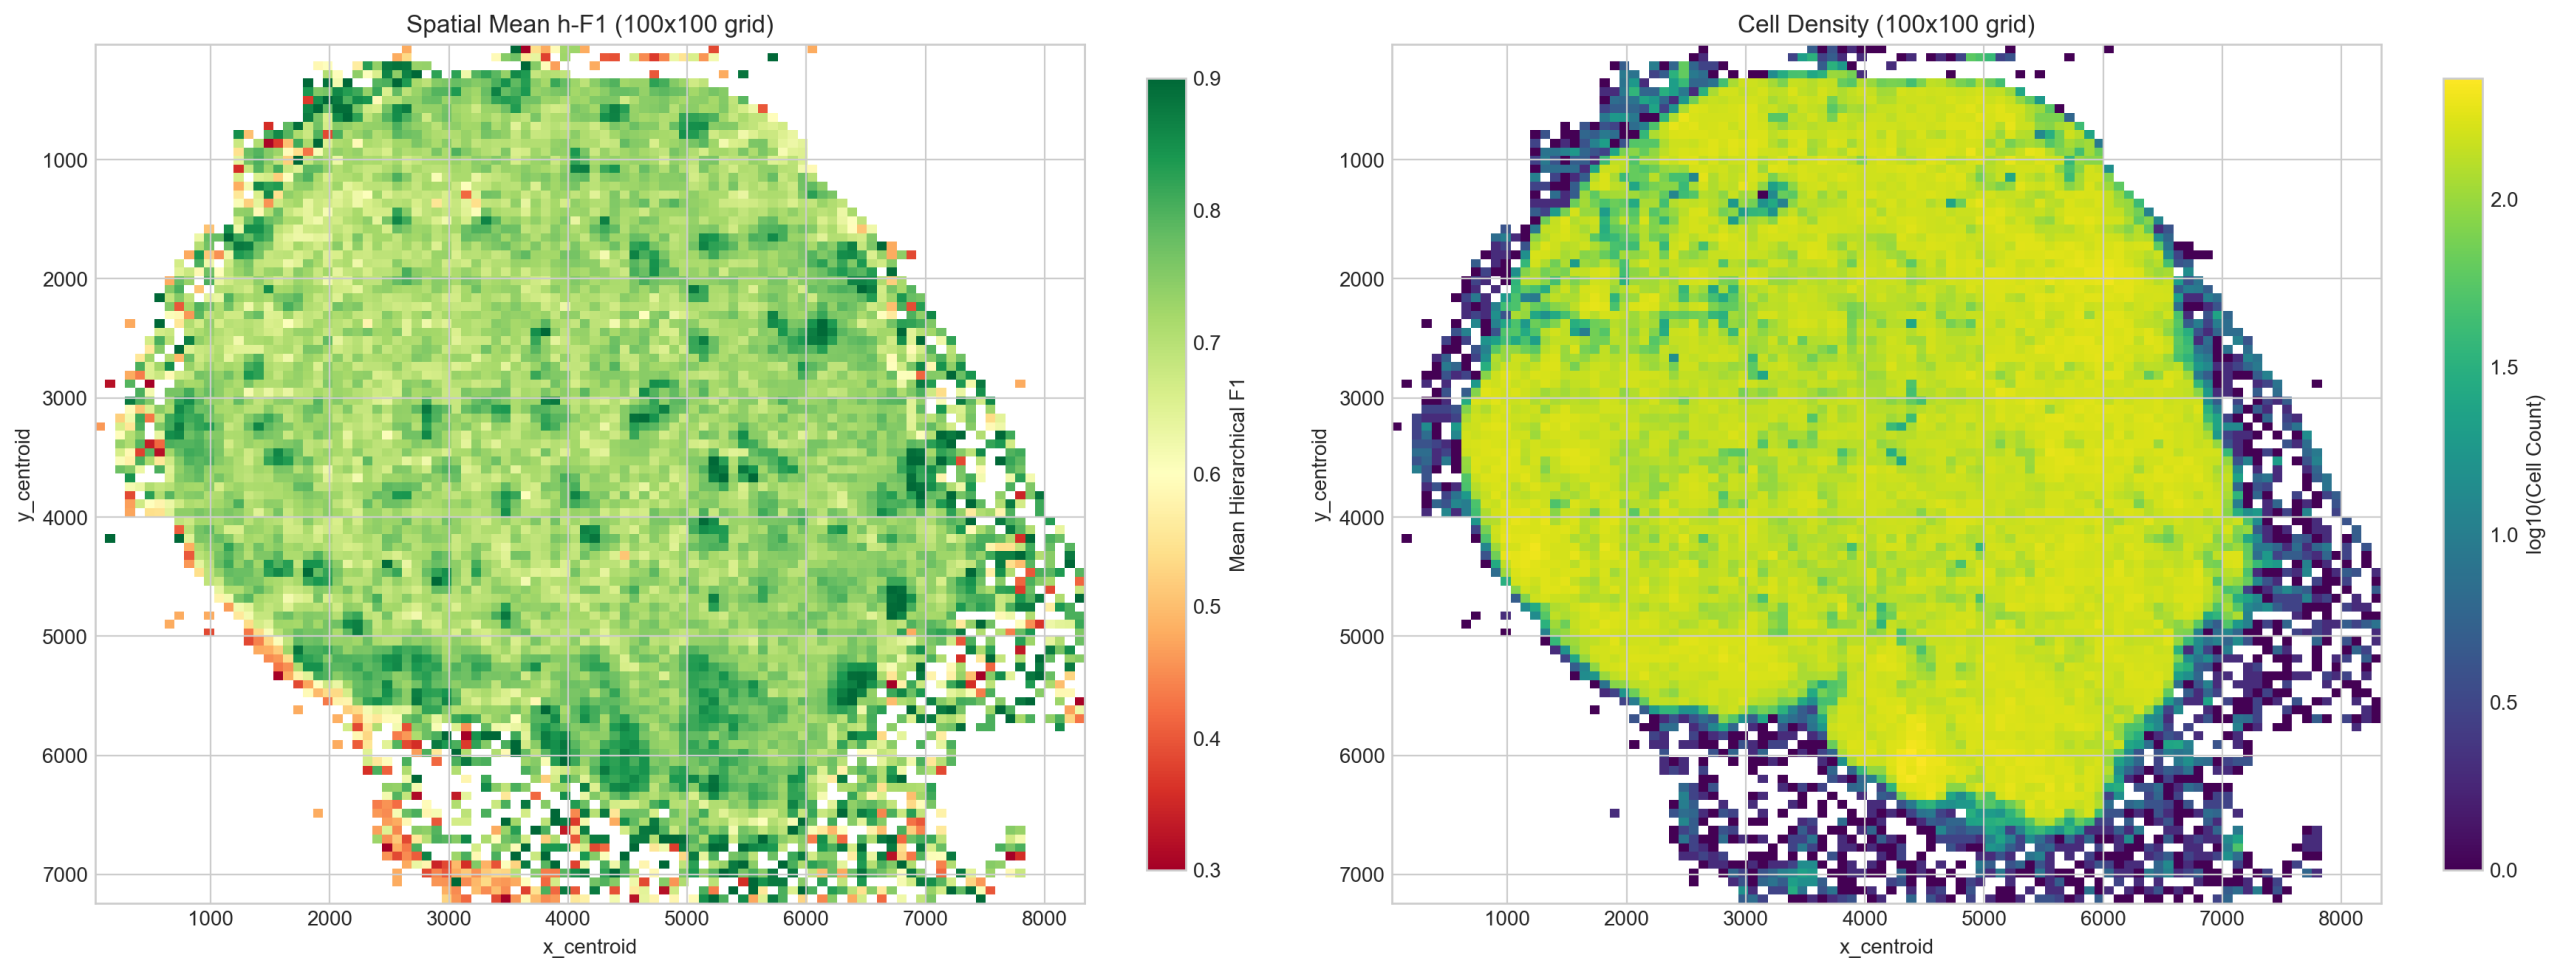
4.2 Spatial Error Patterns
Spatial analysis confirms that low-h-F1 regions correspond to tissue boundaries (endothelial/stromal interfaces) rather than model failure modes. The worst grid bins (mean h-F1 ~0.51) contain cells at the tissue periphery where segmentation artifacts concentrate. High-density lymphoid follicles (B and T cell zones) consistently score h-F1 > 0.90.
4.3 Annotation Pipeline Failures
The vendor annotation pipeline follows a standard single-cell workflow: seurat_v3 HVG selection (2,000 genes) → PCA (50 dims) → Leiden clustering. We identified a causal chain through which this pipeline introduces systematic errors:
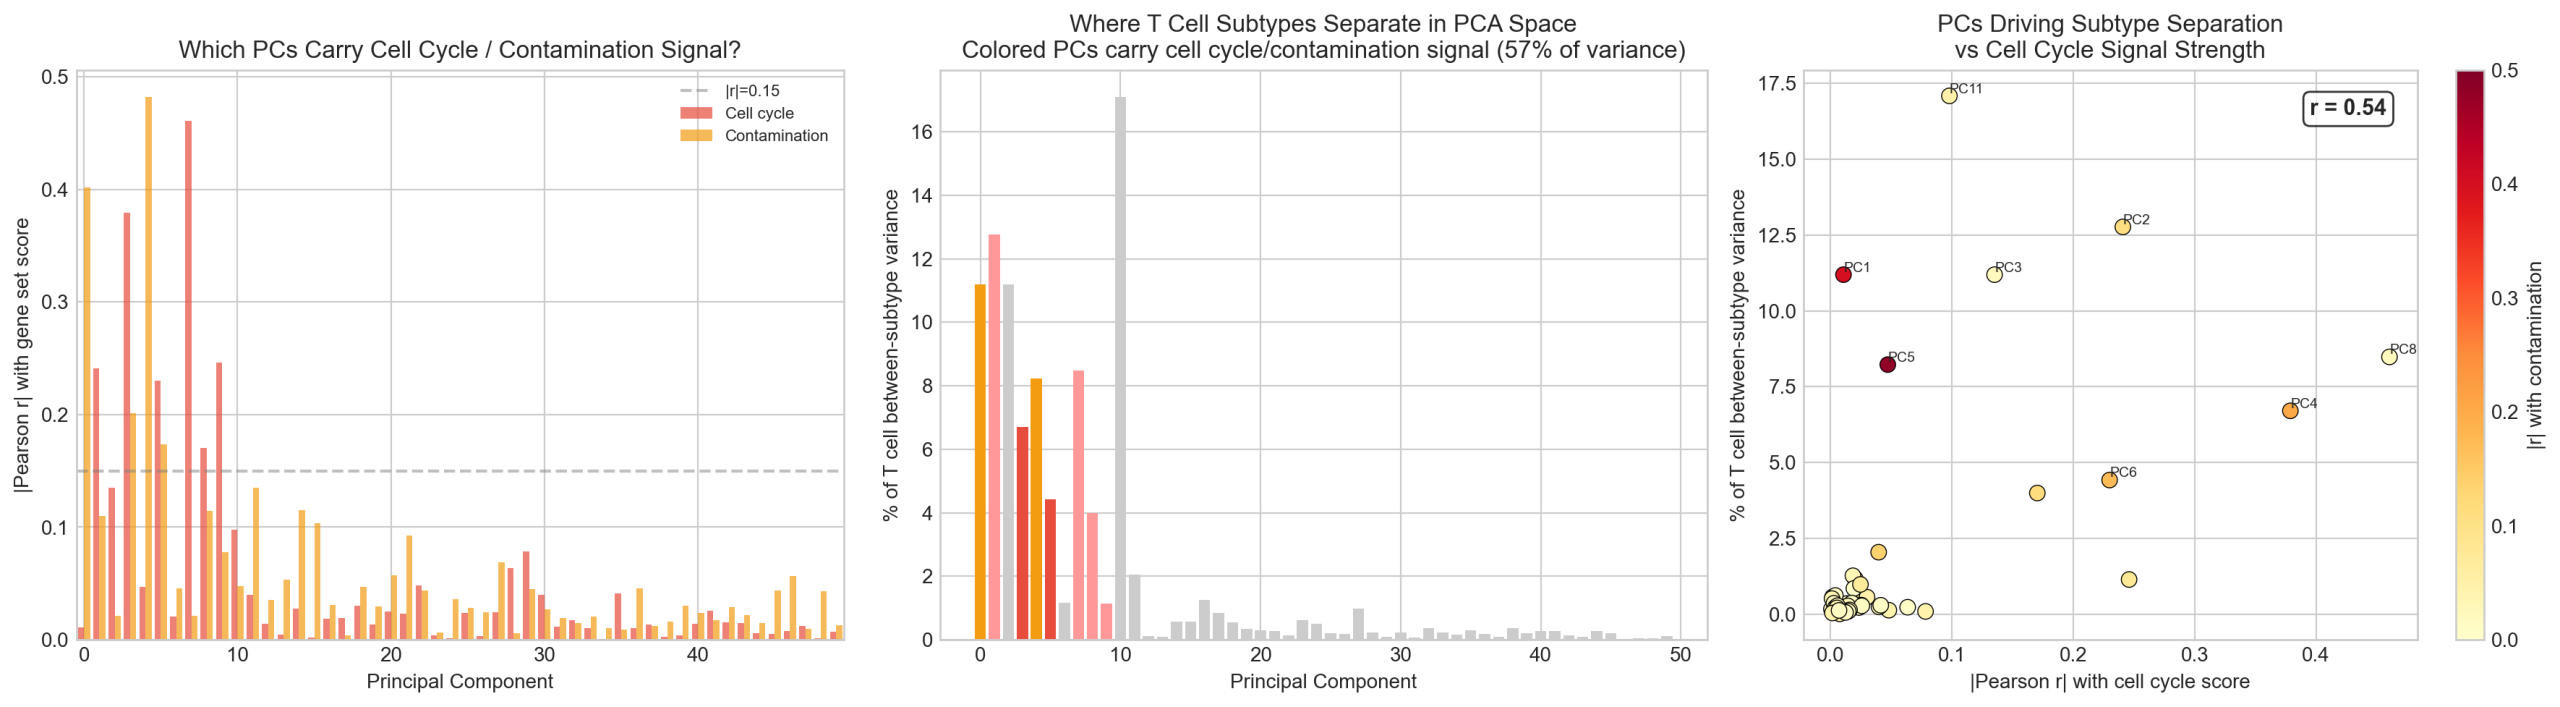
Step 1: HVG selection is biased. Cell cycle genes are 1.8x enriched in the HVG set (76% vs 43% background, Fisher p=1.3e-06). Stromal contamination genes are 2.1x enriched (93% vs 43%, p=1.5e-04). Neither source of variance reflects lineage identity.
Step 2: PCA concentrates the bias. Of 50 PCA dimensions, 8 carry detectable cell cycle or contamination signal (|r| > 0.15). These 8 PCs (16% of dimensions) carry 57% of the between-subtype variance for T cell types.
| PC | Between-type var | Cell cycle |r| | Contamination |r| | Signal |
|---|---|---|---|---|
| PC8 | 8.5% | 0.461 | 0.021 | Cell cycle |
| PC5 | 8.2% | 0.047 | 0.482 | Contamination |
| PC4 | 6.7% | 0.379 | 0.201 | Both |
| PC2 | 12.8% | 0.241 | 0.110 | Cell cycle |
| PC1 | 11.2% | 0.011 | 0.402 | Contamination |
Step 3: Leiden partitions on the concentrated signal. The result is artificial T cell subtypes that differ primarily in cell cycle phase and spatial contamination rather than lineage identity.
Quantitative evidence: T cell subtype pairs differ in only 74-216 DEGs (>2x fold change), with 87-97% being HVGs. The top DEGs are cell cycle markers (TOP2A, MKI67, CENPF) and stromal contamination genes (SVEP1, CCN1, FSTL1). In contrast, biologically distinct pairs (T cell vs Endothelial) show ~1,000 DEGs with only 69% in HVGs.
| Comparison | DEGs | HVG DEGs | % HVG |
|---|---|---|---|
| Naive CD4 vs Eff CD4 | 74 | 71 | 96% |
| Naive CD4 vs Mem CD4 | 140 | 132 | 94% |
| Naive CD4 vs Reg T | 152 | 147 | 97% |
| Naive CD4 vs Mem CD8 | 194 | 169 | 87% |
| Naive CD4 vs Endothelial | 1,045 | 718 | 69% |
Nearest-centroid classification from PCA space achieves only 36.8% overall accuracy. T cell subtypes are worst: Memory CD4 (9.7%), Effector CD8 (4.2%). This confirms that Leiden creates boundaries in dense, overlapping regions of PCA space — not at natural gaps.
In contrast, the model reads the full transcriptome (4,624 genes, weighted by gene embeddings) rather than the HVG-PCA-compressed representation. It correctly refuses to reproduce artificial distinctions created by the annotation pipeline.
4.4 Conclusion
The HVG-PCA-Leiden pipeline has two structural vulnerabilities that produce systematic annotation errors in spatial transcriptomics data:
- Information bottleneck: Compressing 4,624 genes to 2,000 HVGs and then to 50 PCA dimensions discards most lineage-informative signal while retaining — and concentrating — cell cycle and contamination variance. Leiden then partitions on this distorted representation, creating artificial subtypes (T cell subtypes differing in 74-152 DEGs, 94-97% of which are HVGs) and spurious clusters (an entire “HSC” population of 24,642 cells with zero HSC marker expression; see Section 5).
- Spatial blindness: The pipeline operates on expression profiles without accounting for the spatial structure of the tissue. Segmentation artifacts — bleed-through at tissue boundaries, transcript loss in dense regions — introduce systematic expression shifts that the pipeline interprets as biological signal rather than technical noise.
These are not edge cases. Together, the four mechanisms account for ~80K cells (11% of the dataset), and three of the four worst-performing author-labeled types (HSC, stromal, endothelial) are direct consequences of these pipeline failures. The model’s disagreements with the vendor annotations are, in the large majority of cases, corrections rather than errors.
5. Deep Dive: The Naive CD4 T Cell Pattern
5.1 The Vertical Line
The confusion matrix reveals a striking pattern: 15 of 28 author-labeled types have their plurality prediction as “naive thymus-derived CD4-positive, alpha-beta T cell.” The model predicts 135K cells as naive CD4 versus 62K in the author labels — a 2.2x expansion. This “vertical line” means many different author-labeled types collapse to a single model prediction.
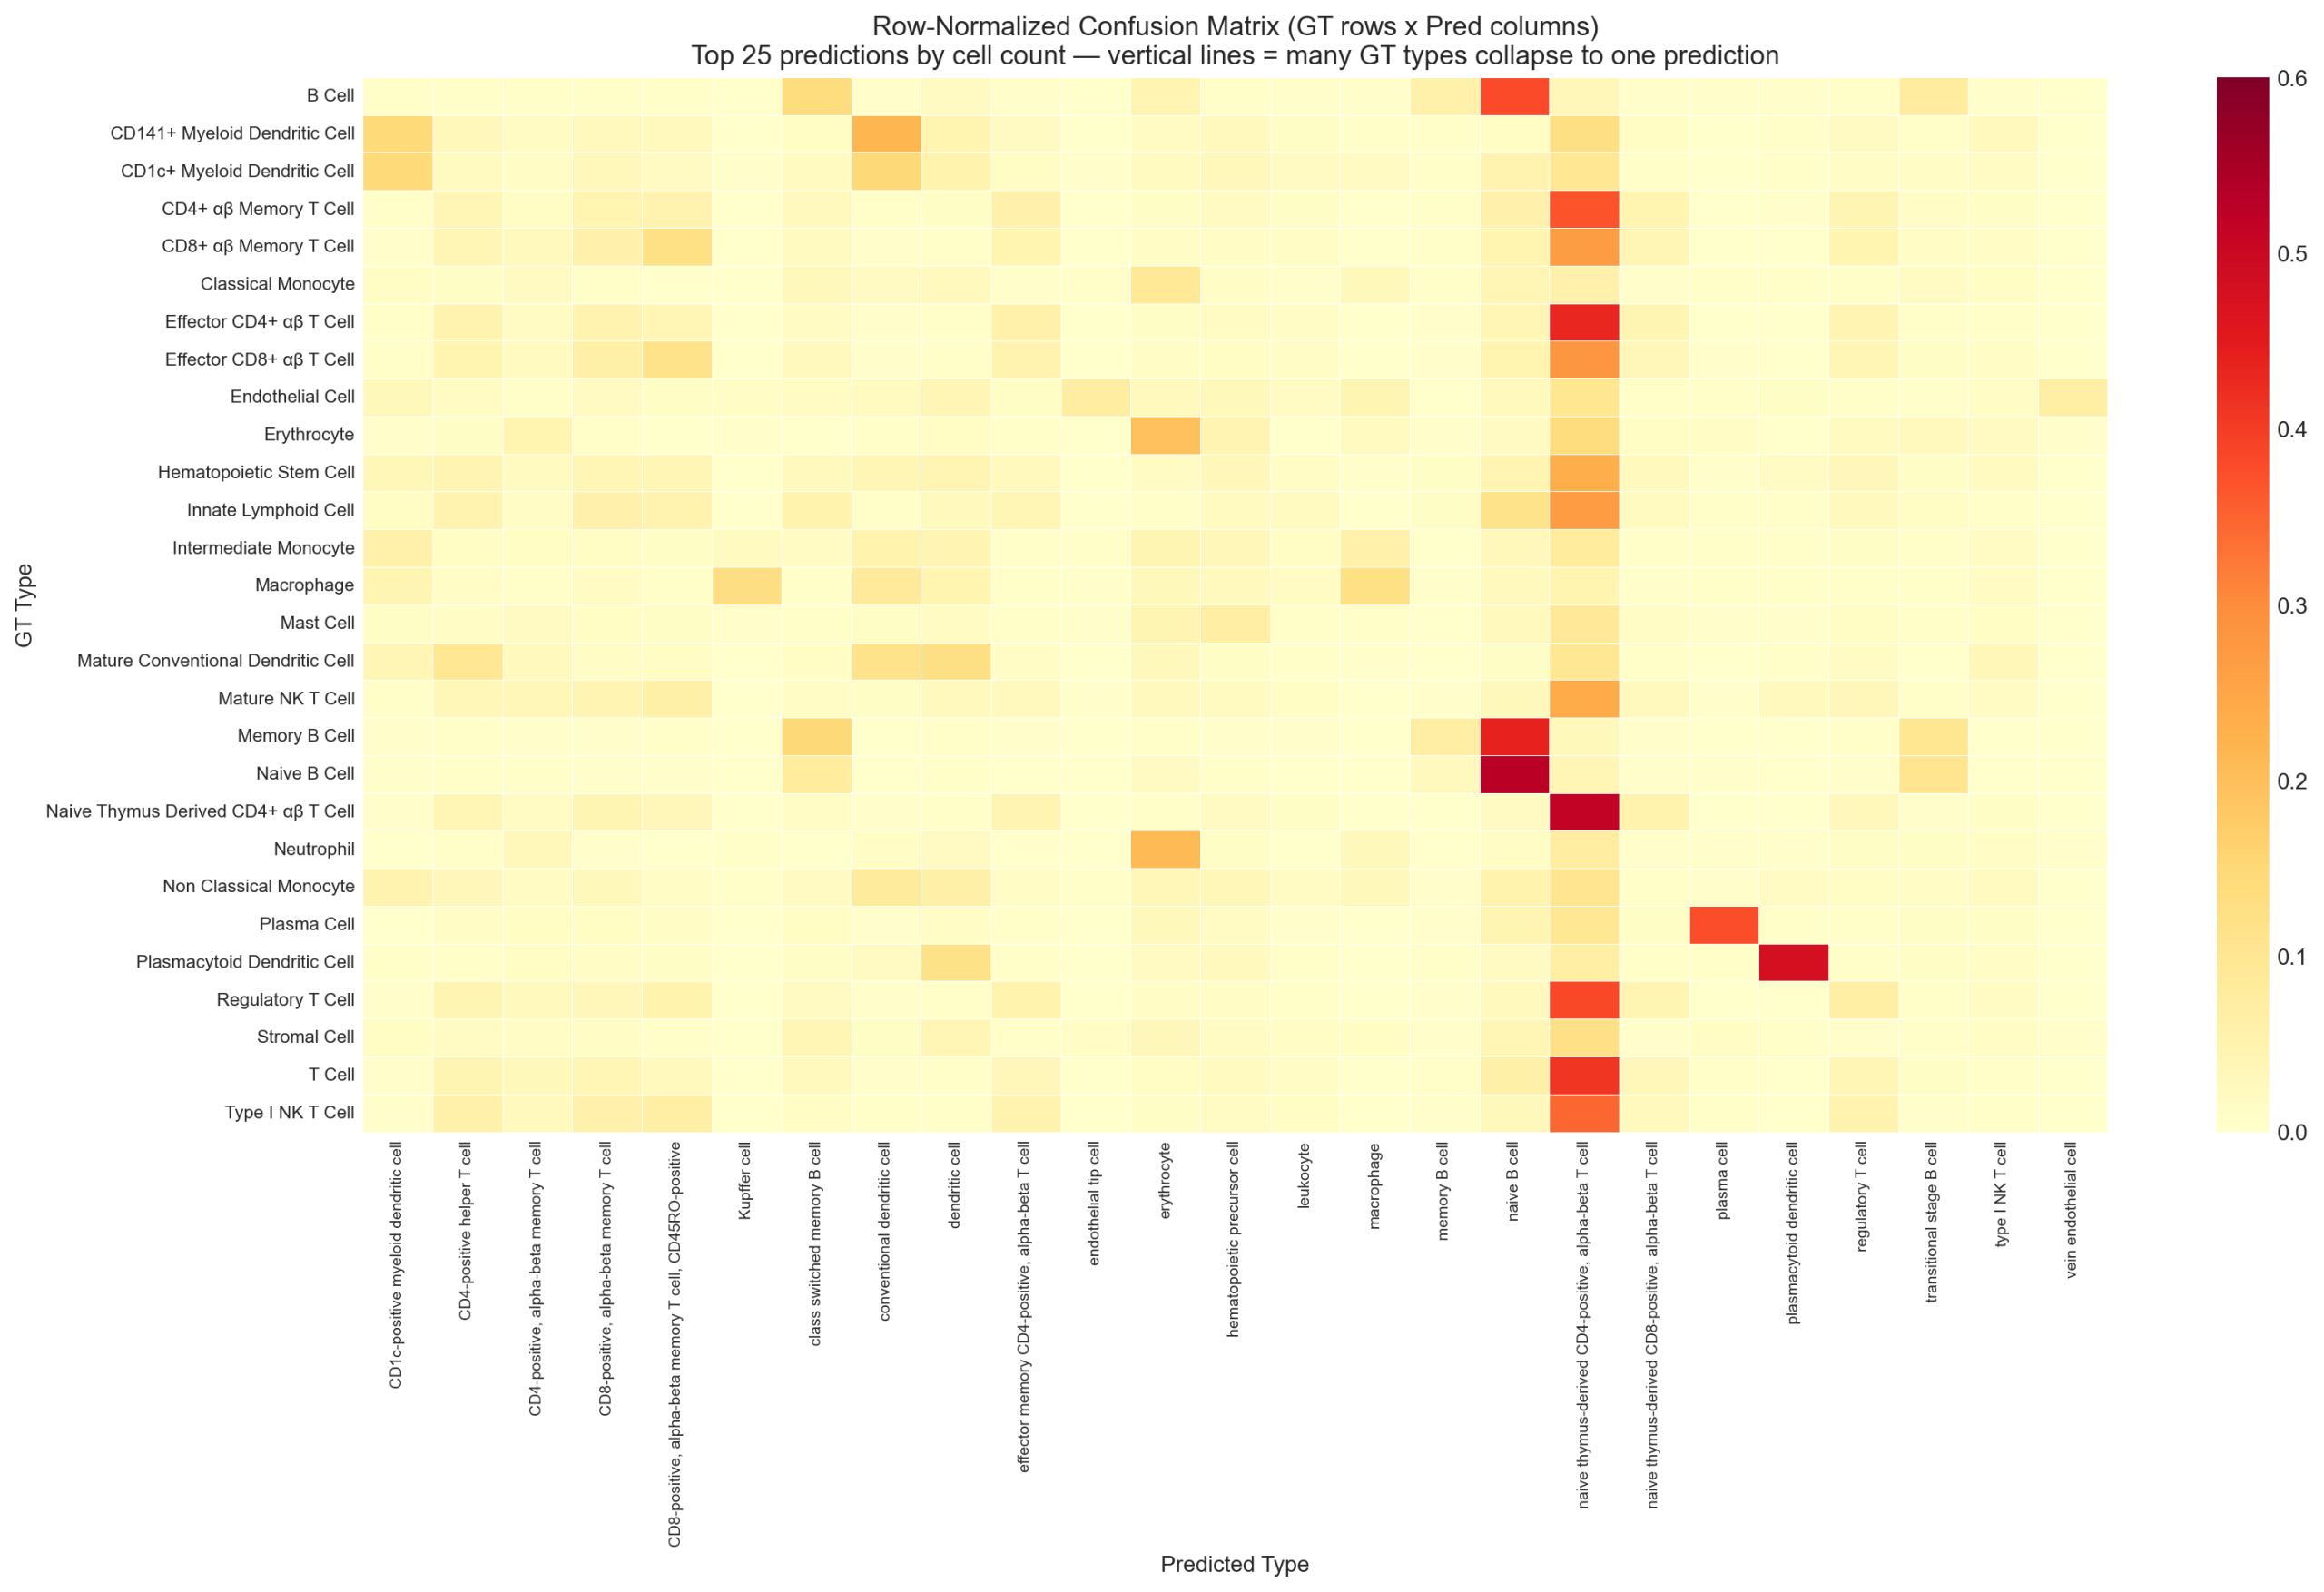
5.2 Marker Validation
For every author-labeled type with >10% naive CD4 “leakage,” we performed marker-by-marker validation. The disputed cells consistently express the naive T cell transcriptional program (TCF7+, LEF1+, SELL+, MAL+) with low expression of subtype-specific markers (FOXP3 for Treg, GZMB for effector).
5.3 Non-T Cell Disagreements
For each major non-T cell disagreement, we assessed mechanism, spatial enrichment, and morphology:
| Author Label | n cells | Mechanism | Spatial Enrichment (5 μm) | Cell Area | Assessment |
|---|---|---|---|---|---|
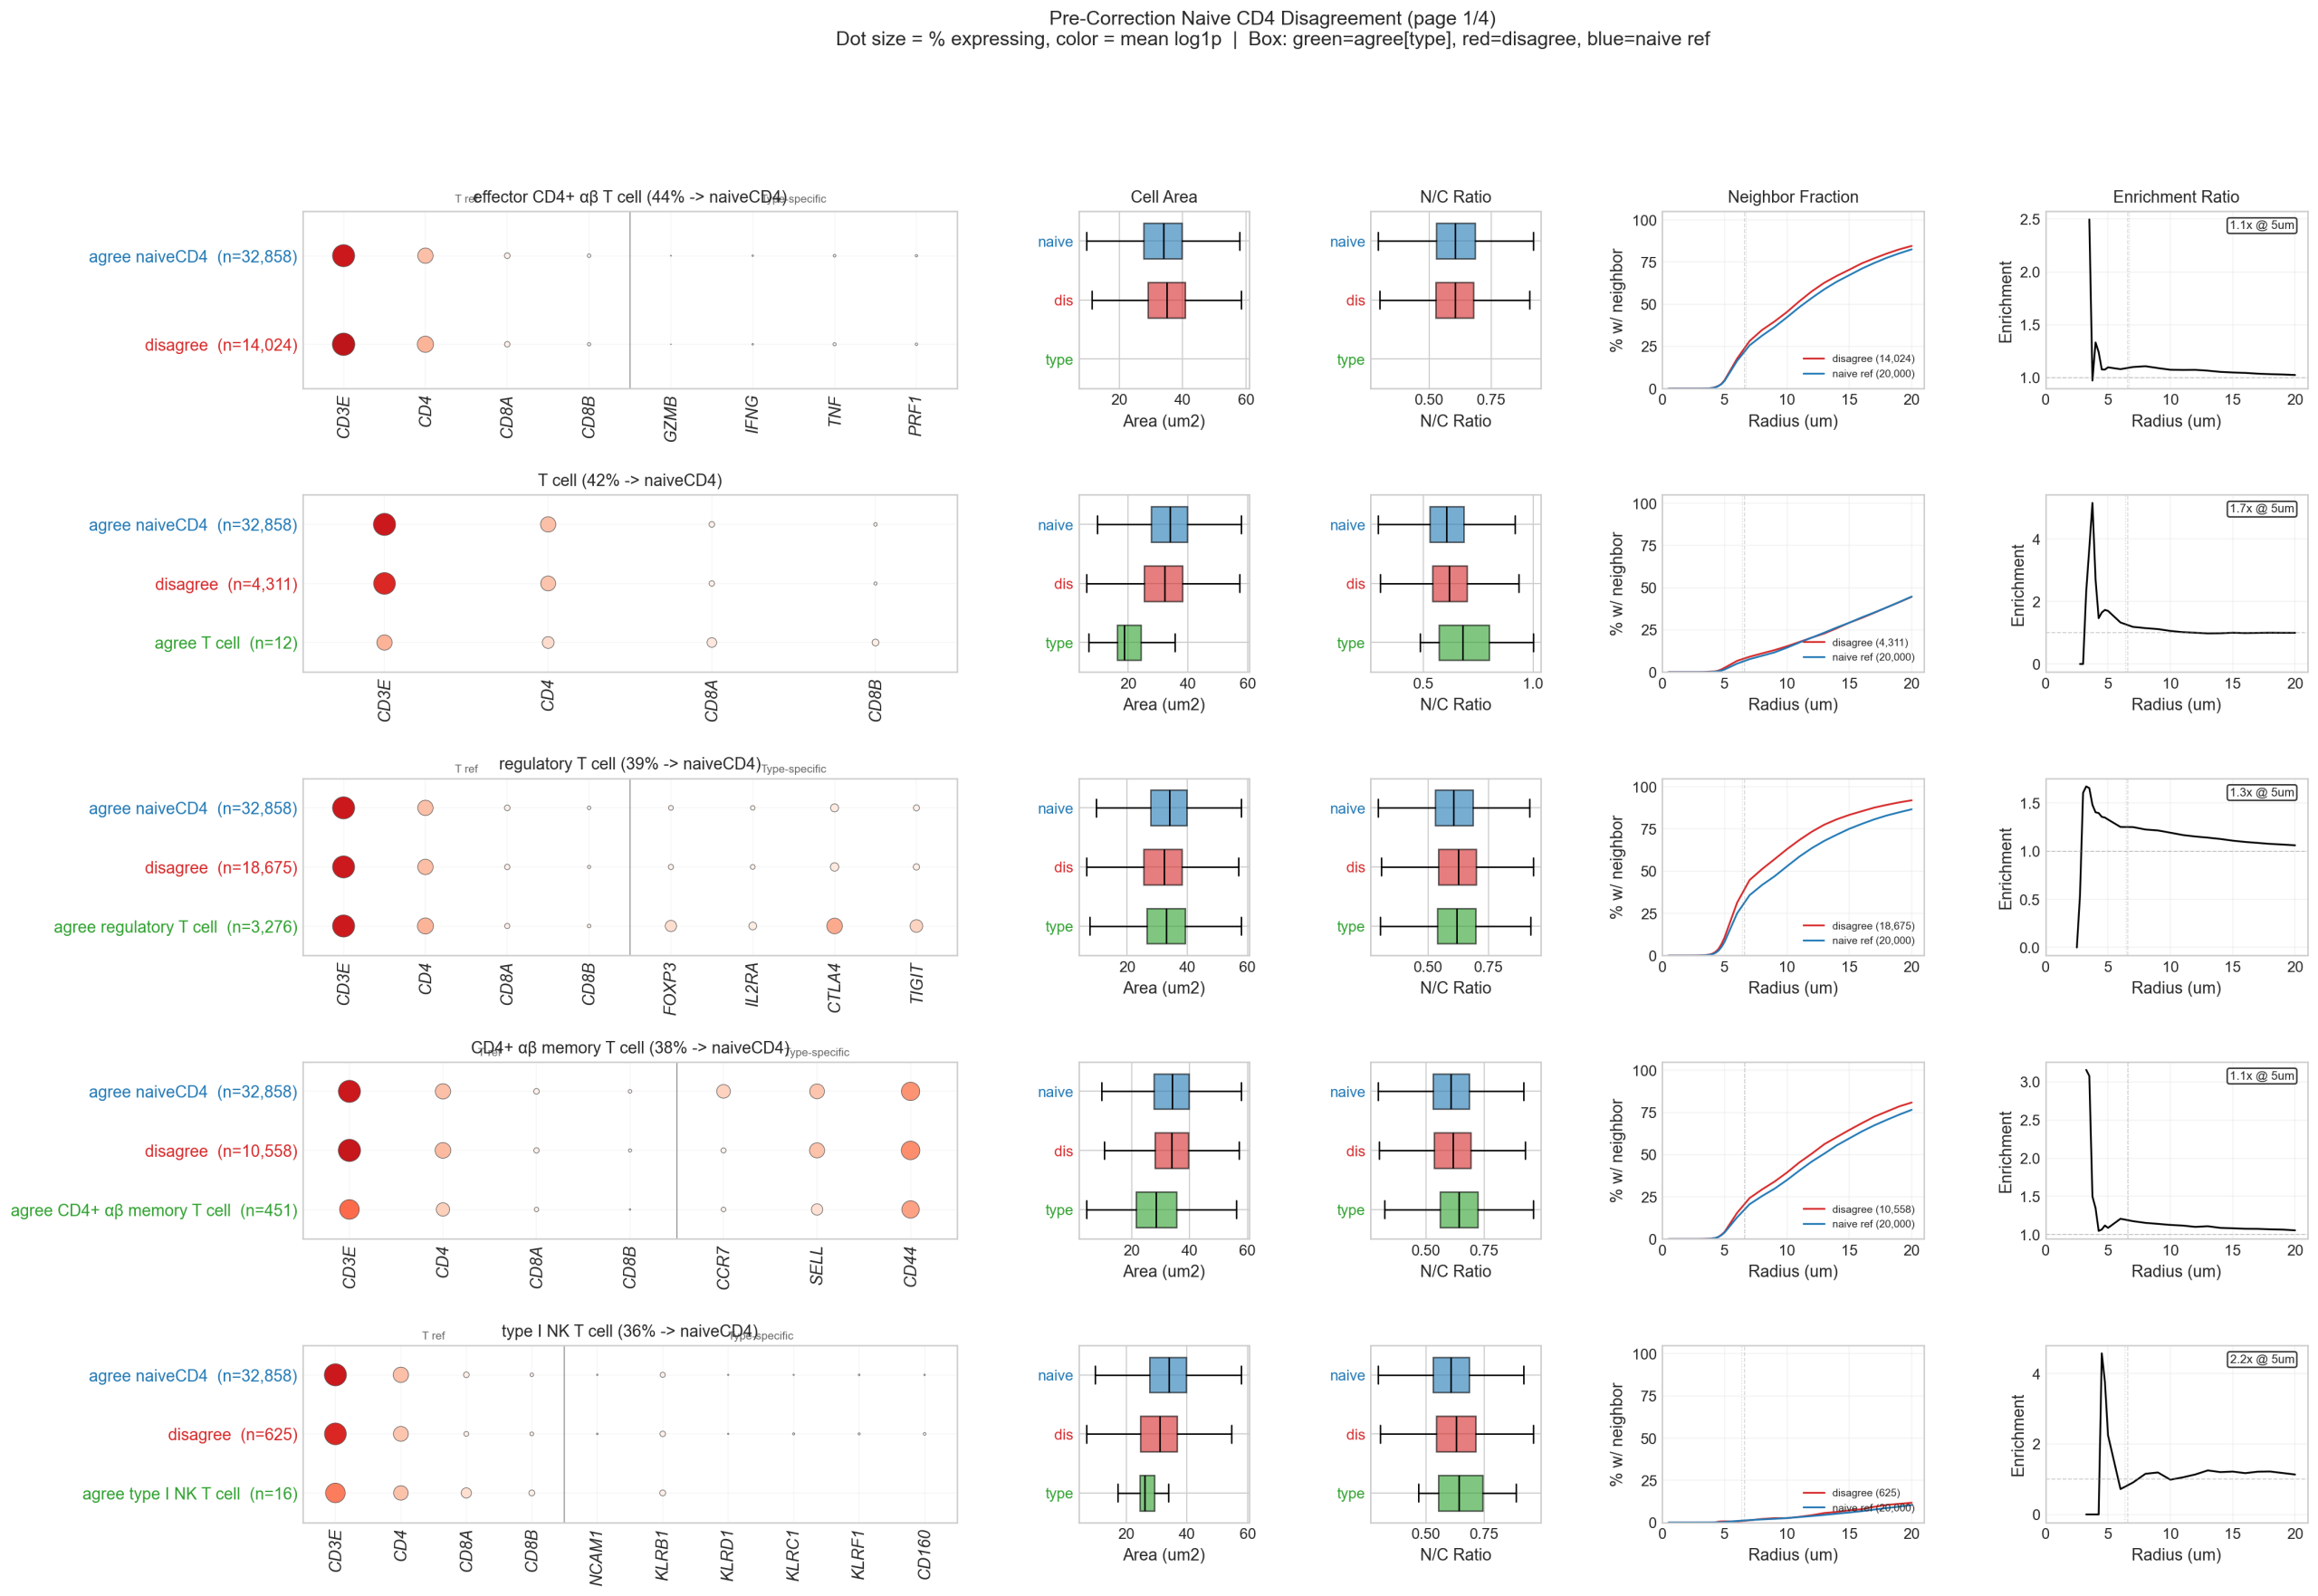
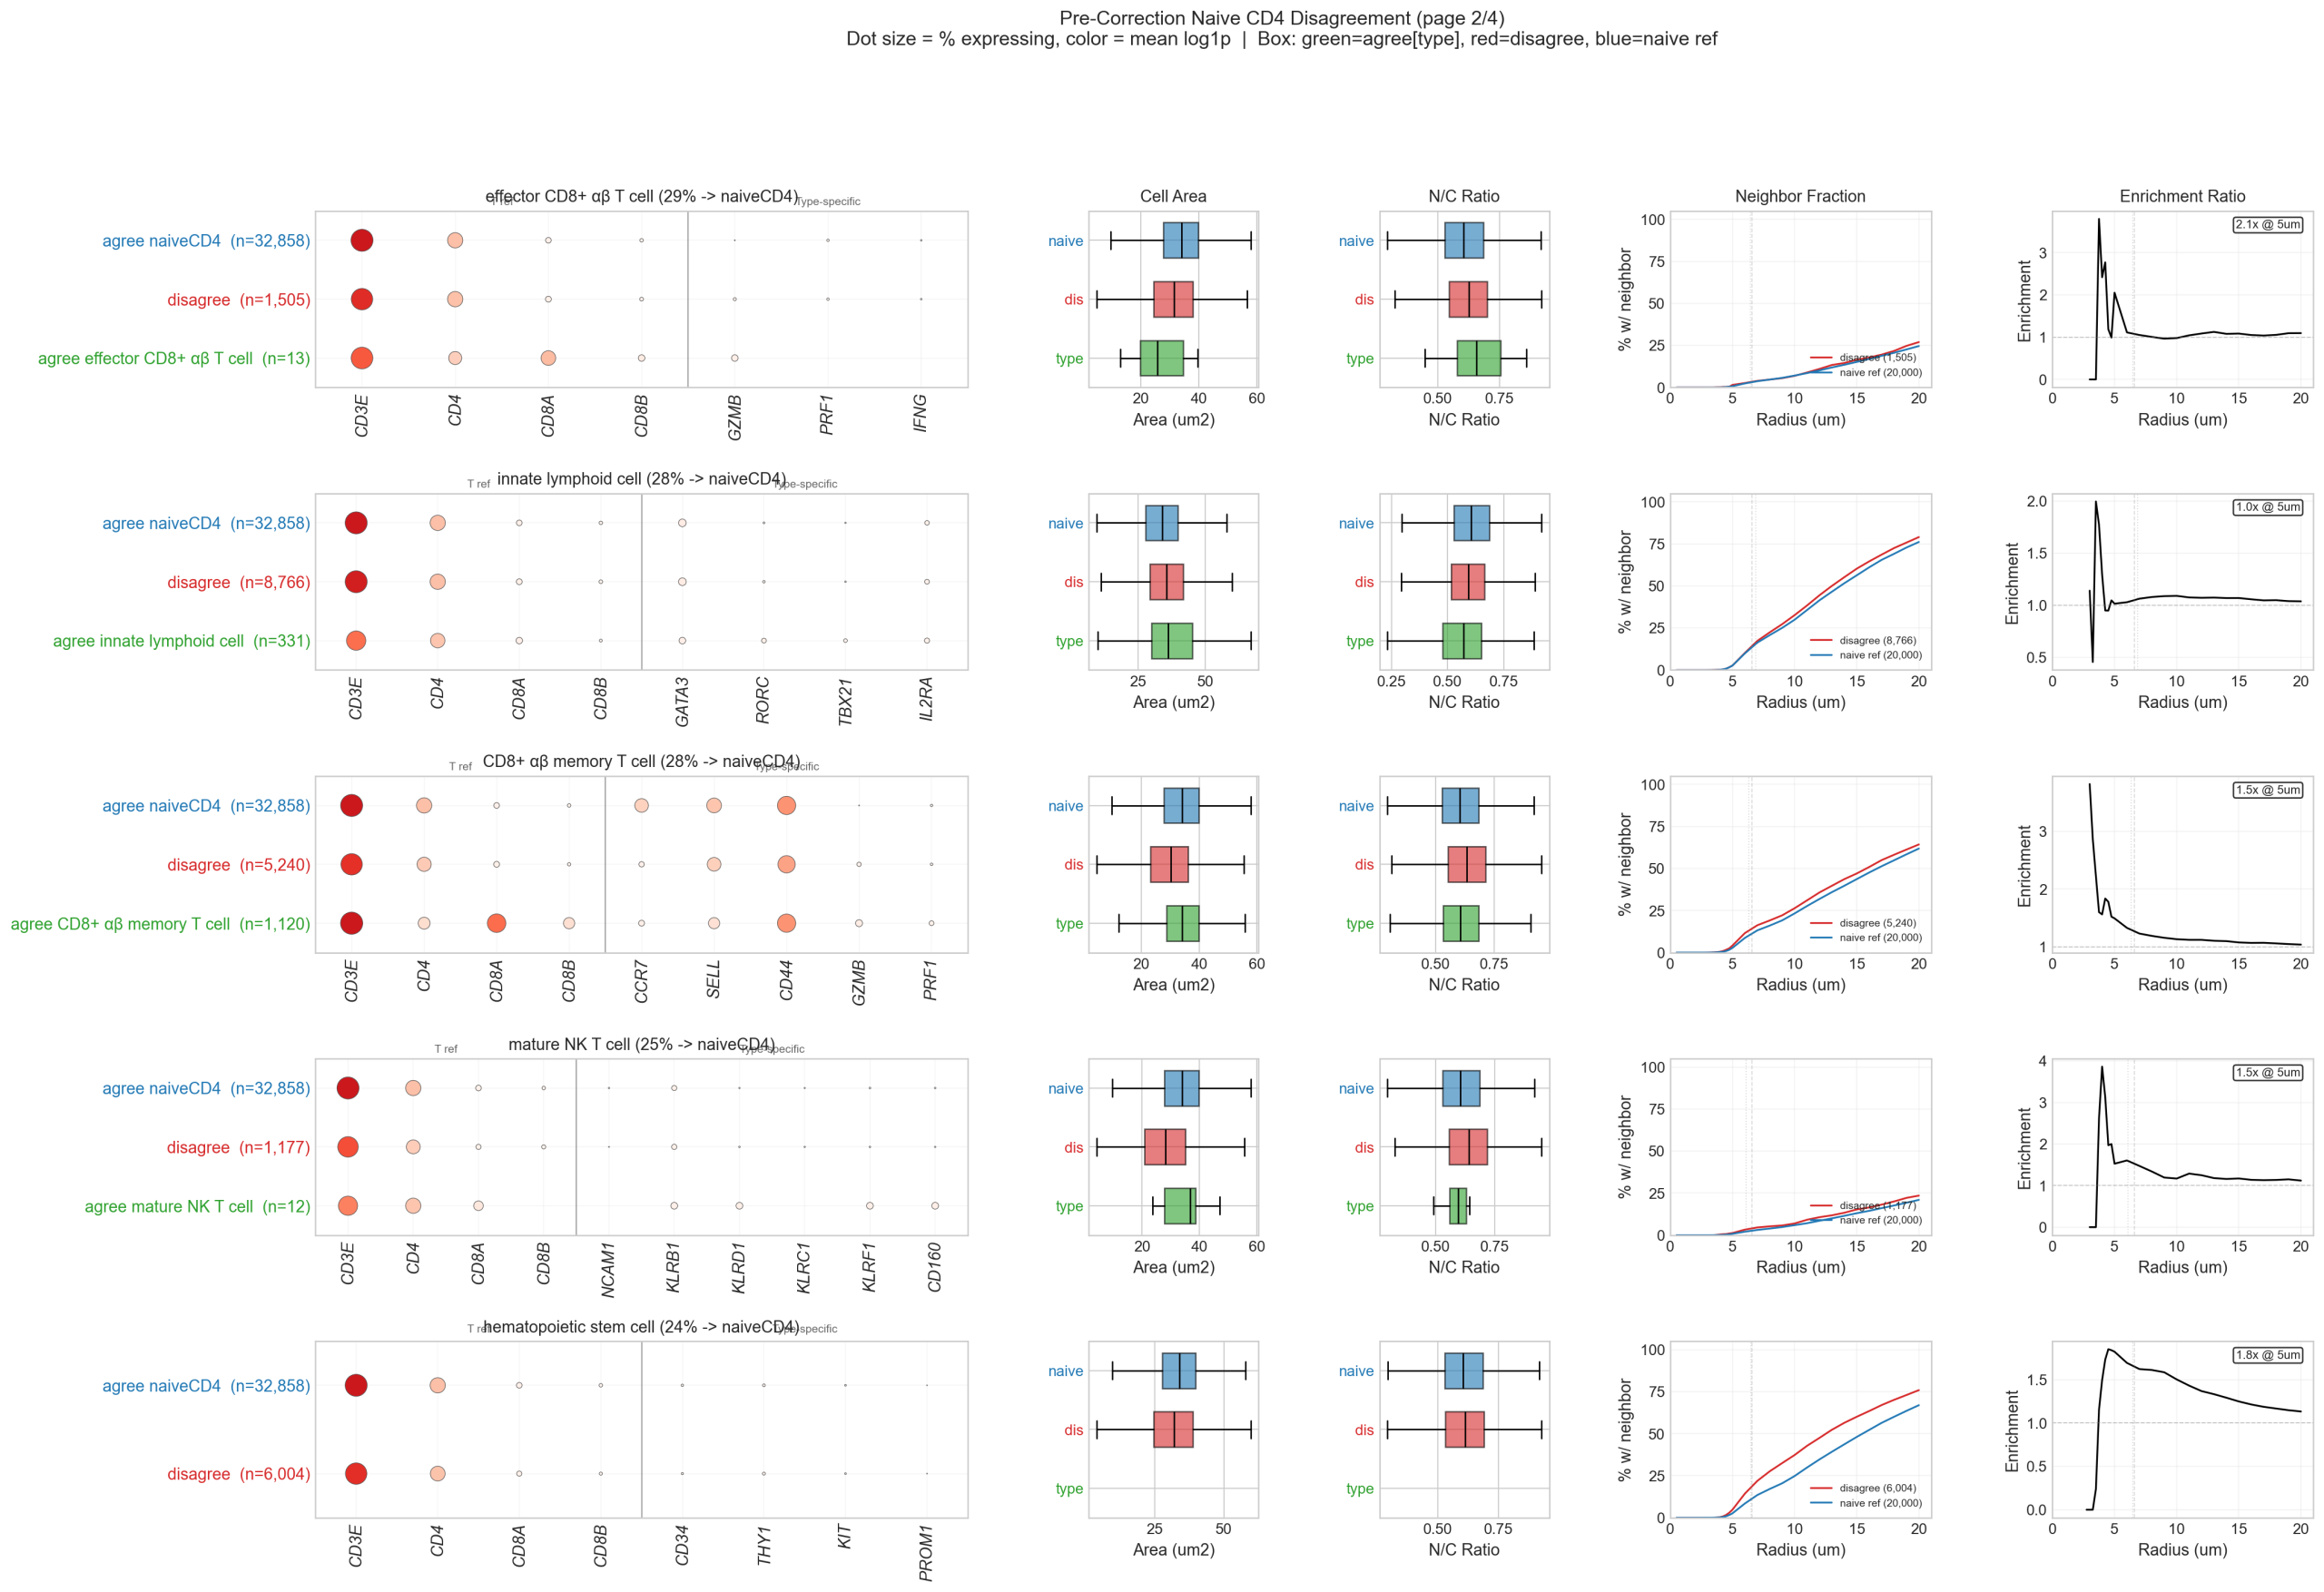
| Endothelial | 12,304 | Seg. bleed | 3.2x | 33.6 μm² (T cell) | Model correct |
| ILC | 8,499 | Author misannotation | 1.0x (none) | 35.7 μm² (T cell) | Model correct |
| Stromal | 7,128 | Noisy interface | 2.7x | 29.2 μm² (small) | Model defensible |
| HSC | 5,757 | Author misannotation | 1.8x | 32.2 μm² (T cell) | Model correct (see Section 5.7) |
| Plasma | 2,451 | Seg. bleed | 6.5x | 27.7 μm² (v. small) | Model defensible |
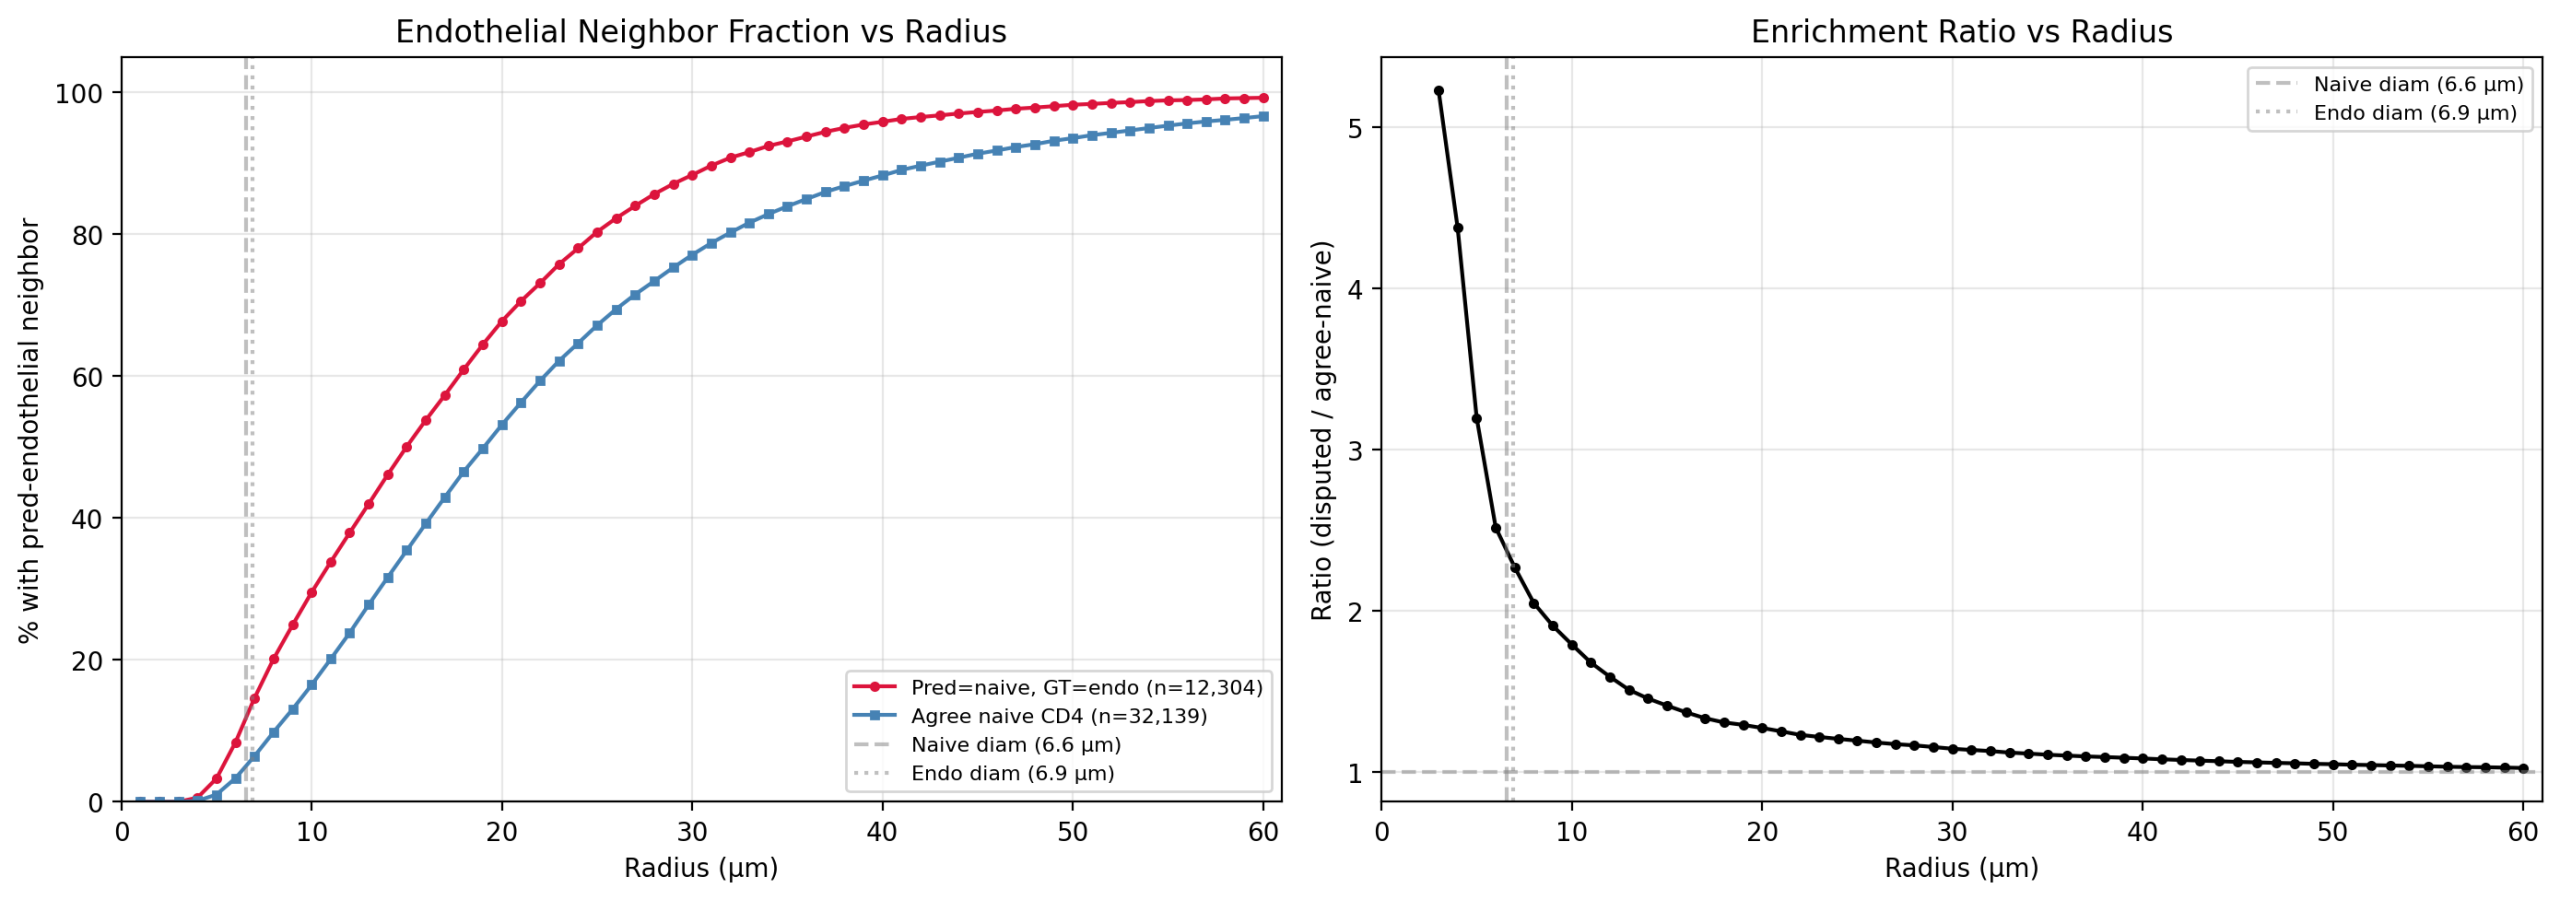
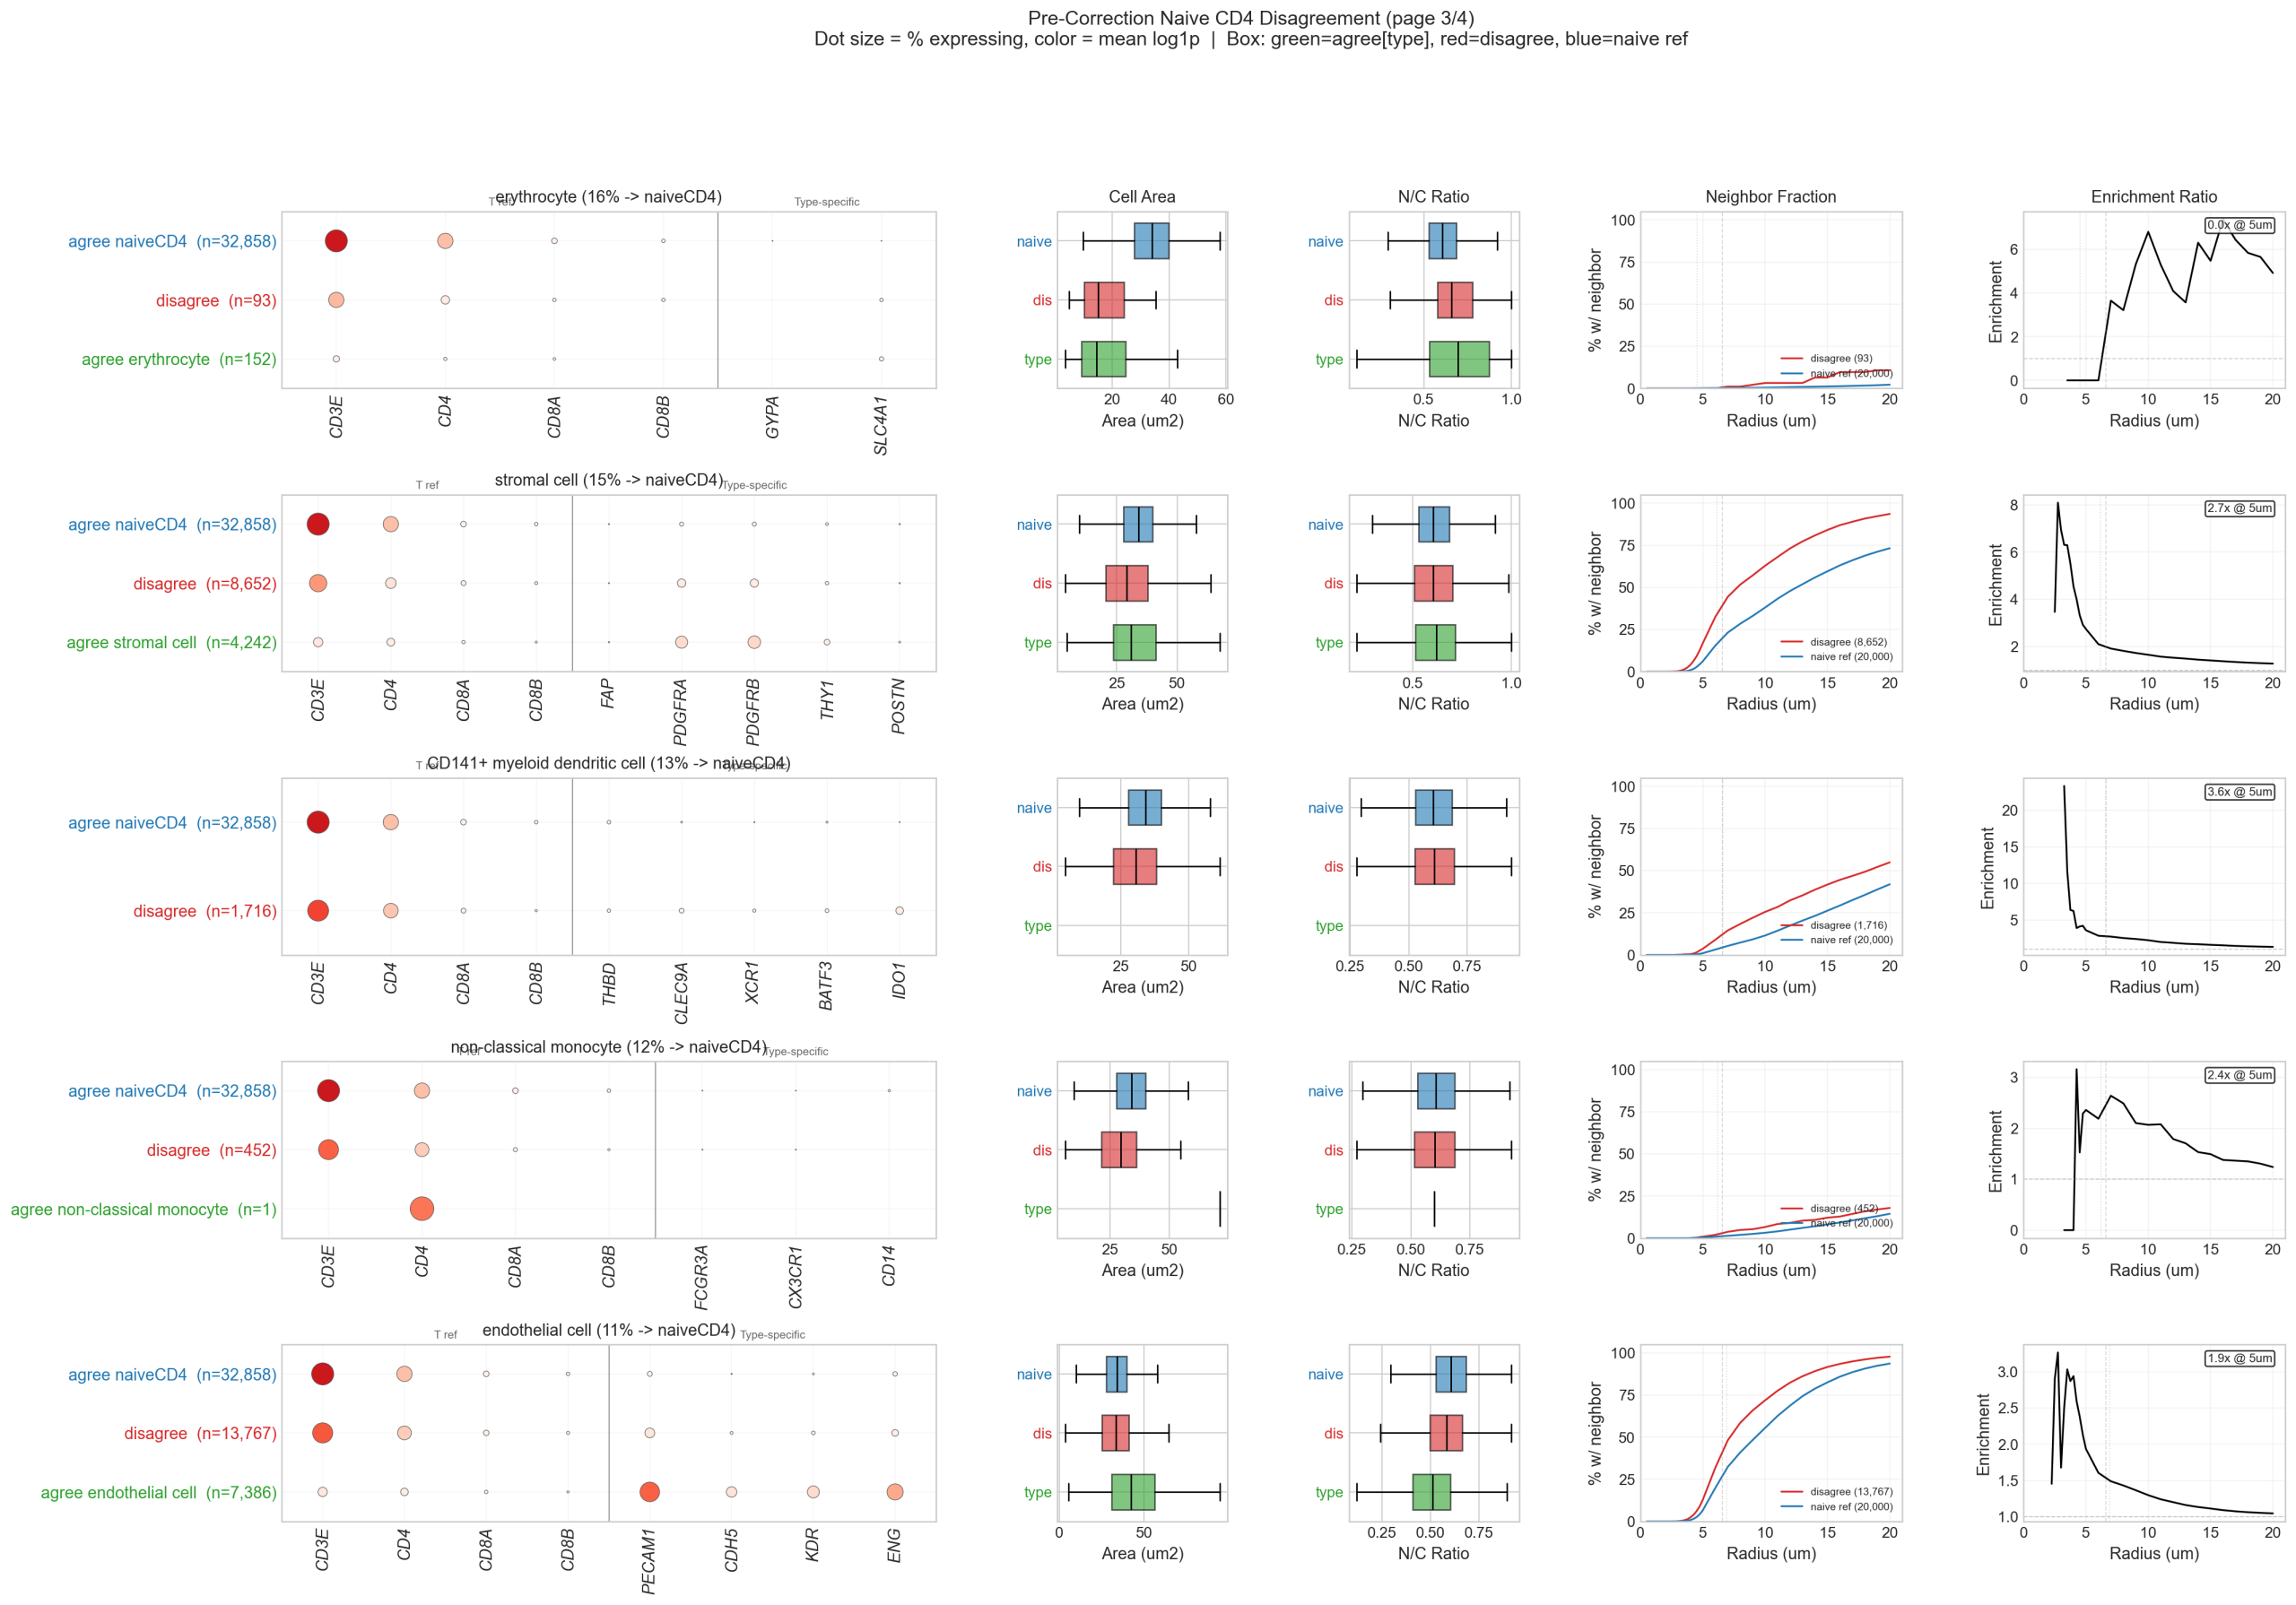
Endothelial (12K cells): Disputed cells have T cell morphology (33.6 μm² vs 58.1 μm² for true endothelial), are spatially enriched near endothelial cells (3.2x at 5 μm), and express low PECAM1 (0.13 vs 0.43 in true endothelial). These are T cells that picked up a few endothelial transcripts from adjacent cells during segmentation.
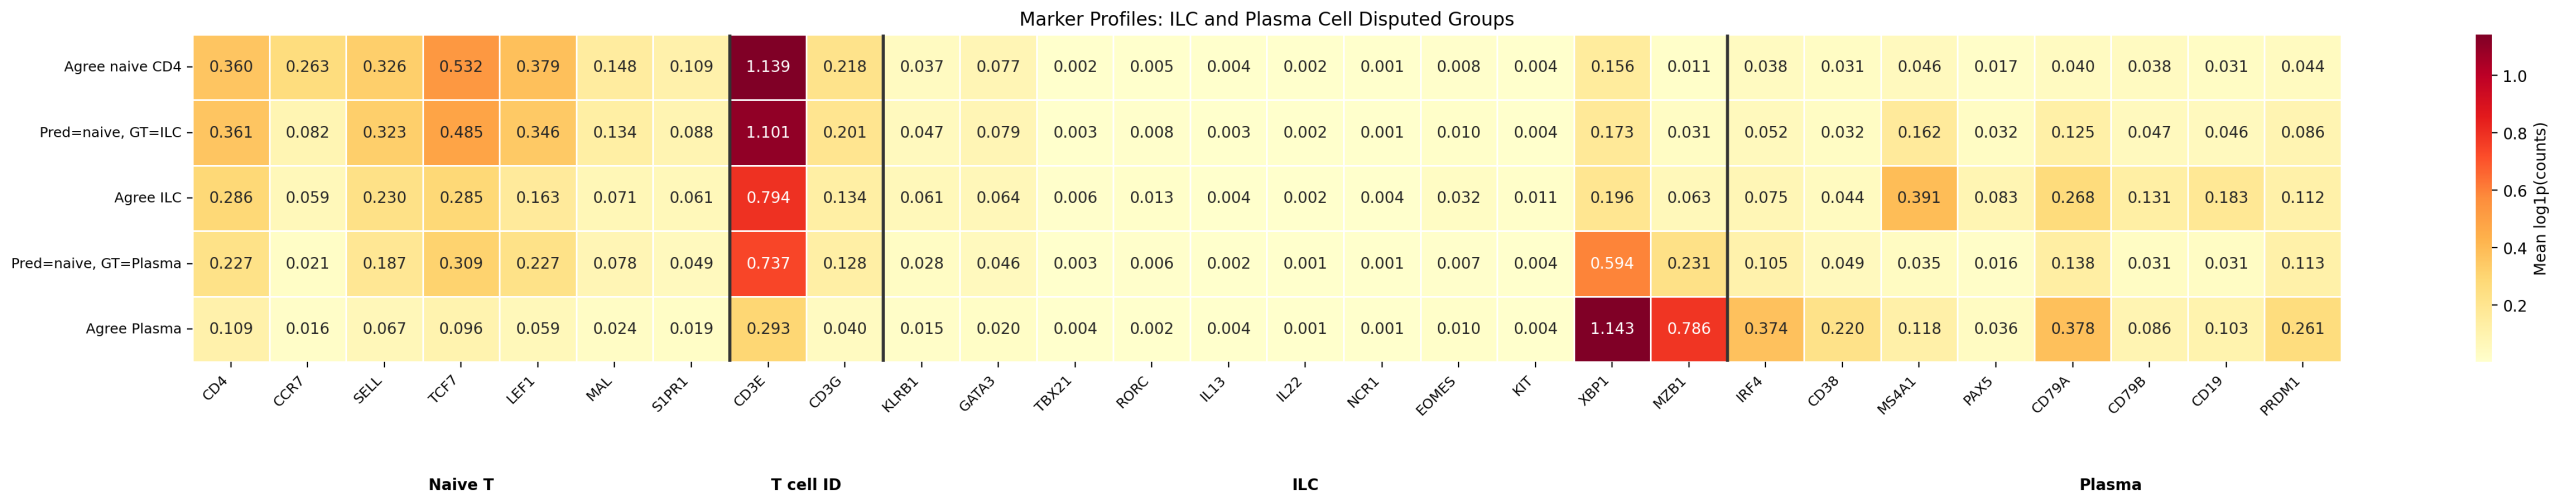
ILC (8.5K cells): Disputed cells express CD3E at 1.101 (T cell-level TCR expression) while all ILC-specific markers are at background. No spatial enrichment at any distance (1.0x). These are T cells misassigned to an ILC Leiden cluster because ILCs and T cells share transcription factors (GATA3, TCF7).
HSC (6K cells): Clean naive T cell profile with HSC markers (CD34, KIT, GATA2) at background. Misassigned to an HSC Leiden cluster despite lacking any HSC markers. This 6K subset is just the naive-CD4-predicted fraction; Section 5.7 shows the entire 24,642-cell HSC population is a Leiden artifact.
Plasma (2.5K cells): Very small cells (27.7 μm²), strong spatial enrichment (6.5x at 5 μm). T cell markers present (CD3E=0.74) with plasma contamination (XBP1=0.59, MZB1=0.23). The dominant transcriptomic signal is T cell.
Stromal (7K cells): Intermediate naive T markers (3-4x above stromal baseline) with elevated PDGFRA/B. Spatially enriched (2.7x at 5 μm). Small cells (29.2 μm²) at the fibroblastic reticular cell (FRC)-T cell interface.
5.4 Per-Type h-F1 Before and After Correction
Naive CD4 T cell h-F1 improves from 0.907 to 0.946 after corrections absorb the misannotated cells into the naive CD4 class. Types that lose misannotated cells (ILC, HSC, endothelial, stromal) also improve as their remaining cells are higher-quality annotations.
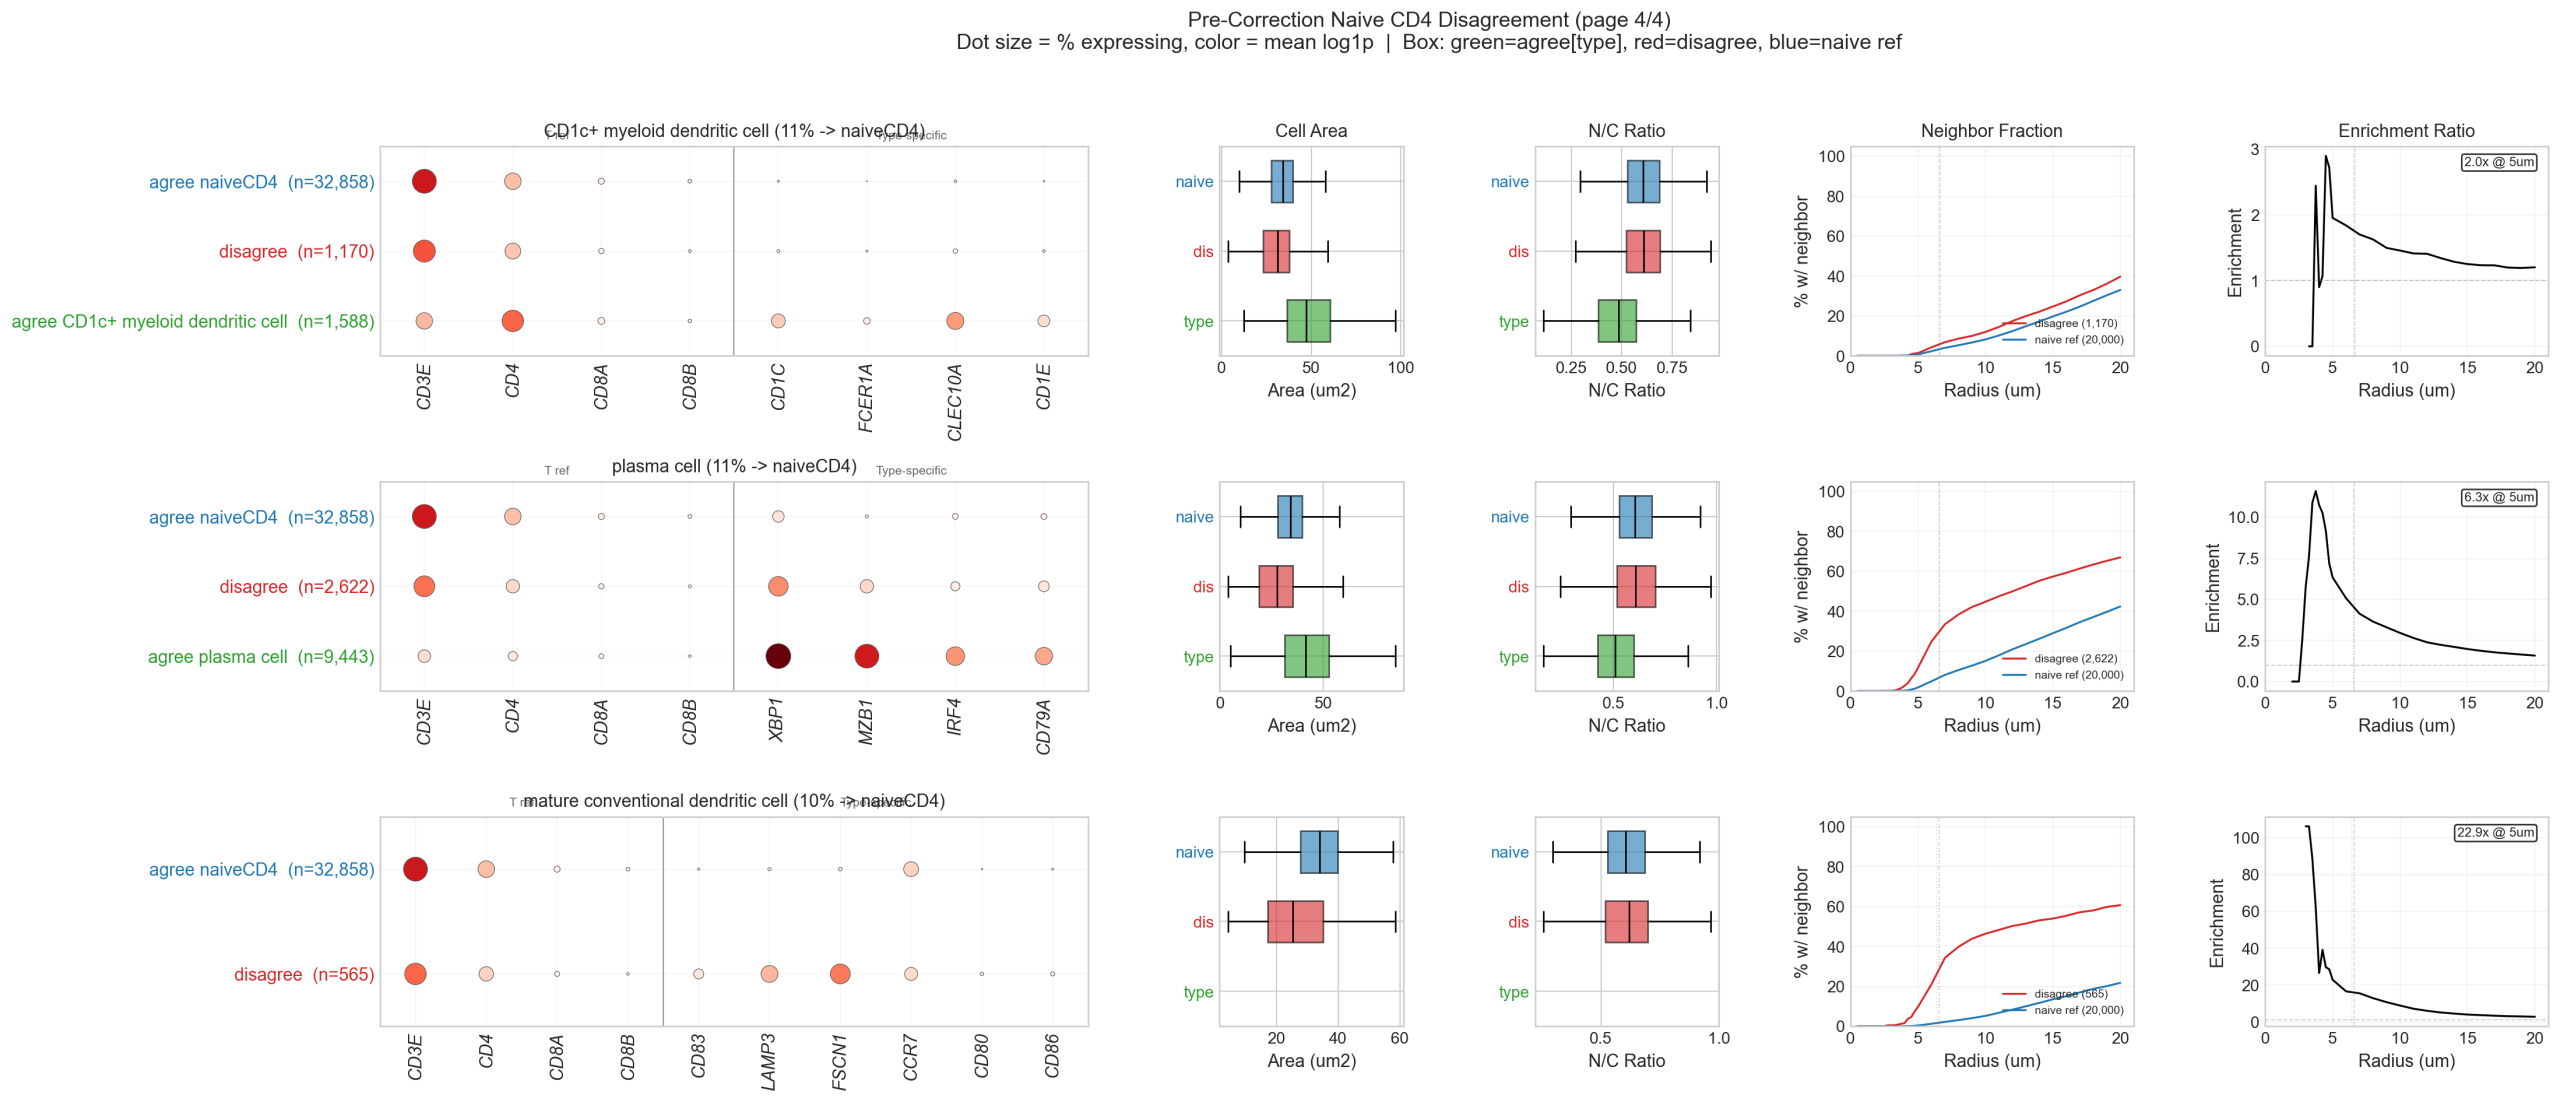
5.5 Naive CD4 Disagreement Panels
Multi-panel analysis of every disputed author-labeled type, showing marker expression, spatial context, and morphology side by side:
5.6 Conclusion
The naive CD4 “vertical line” — where 15 of 28 author-labeled types have their plurality prediction as naive CD4 — is not a model failure mode. It is the model correctly identifying ~73K cells that share a naive T cell transcriptional program but were scattered across different Leiden clusters by the author pipeline. Three distinct mechanisms explain these disagreements:
- Author misannotation (~14K cells: ILC, HSC): Cells with unambiguous T cell marker profiles (CD3E >1.0, TCF7 >0.4) and zero expression of their assigned type’s markers. No spatial enrichment, T cell morphology. The Leiden pipeline assigned these to non-T clusters based on shared transcription factors or cell cycle signal.
- Segmentation bleed-through (~15K cells: endothelial, plasma): Small T cells spatially adjacent to unlike cell types (3-6x enrichment at 5 μm), with T cell morphology and dominant T cell markers contaminated by a few foreign transcripts.
- Noisy interfaces (~7K cells: stromal): Cells at intimate FRC-T cell contacts with intermediate marker profiles, spatially enriched (2.7x) and morphologically small (29 μm²).
In every case, the model’s prediction aligns with the dominant transcriptomic signal. The corrections in Sections 2.2 (Tiers 1-3) reclassify these cells accordingly, improving overall h-F1 by 3.1 percentage points without changing any model predictions.
5.7 The HSC Leiden Artifact
HSC (hematopoietic stem cell) has the worst h-F1 of all 28 author-labeled types (0.41). A comprehensive analysis of all 24,642 author-labeled HSC cells confirms the entire population is a Leiden clustering artifact. Five lines of evidence converge:
- No HSC identity: All 13 canonical HSC markers (CD34, KIT, GATA2, RUNX1, FLT3, SPN) are at background levels across the full population — no subgroup shows elevated HSC marker expression.
- True heterogeneity: The model distributes predictions across 210 distinct types — predominantly T cells (55.9%), DCs (14.3%), and B cells (11.1%), with only 3.4% predicted as any HSC or progenitor type. Cells in each subgroup express lineage markers of their predicted type: HSC→naive CD4 cells show CD3E=1.02, TCF7=0.46 (comparable to the agreed naive CD4 reference at CD3E=1.14, TCF7=0.53); HSC→naive B cells show CD19=0.45, MS4A1=0.48.
- No spatial coherence: All prediction groups span the full tissue with nearly identical spatial spread (x_std ~1,650, y_std ~1,550 for all groups), inconsistent with real subpopulations.
- Biologically implausible prevalence: The 3.5% HSC rate in this lymph node is >300x above expected levels. The model predicts only 193 cells (0.027%) as any HSC type across the full dataset — a 128x reduction consistent with known biology.
- h-F1 decomposition: HSC is at ontology depth 3; most predictions are at depth 5-9 and share only 2-3 ancestor nodes, yielding per-cell h-F1 values of 0.35-0.44. The aggregate h-F1 of 0.41 reflects ontological distance from the true cell identities, not a model failure.
The entire 24,642-cell HSC population is a Leiden clustering artifact. The existing Tier 1 correction (Rule R2) only reclassified the 5,757 cells predicted as naive CD4. Based on this investigation, all 24,642 cells are misannotated and should be reclassified to match the model’s predictions where validated by marker expression.
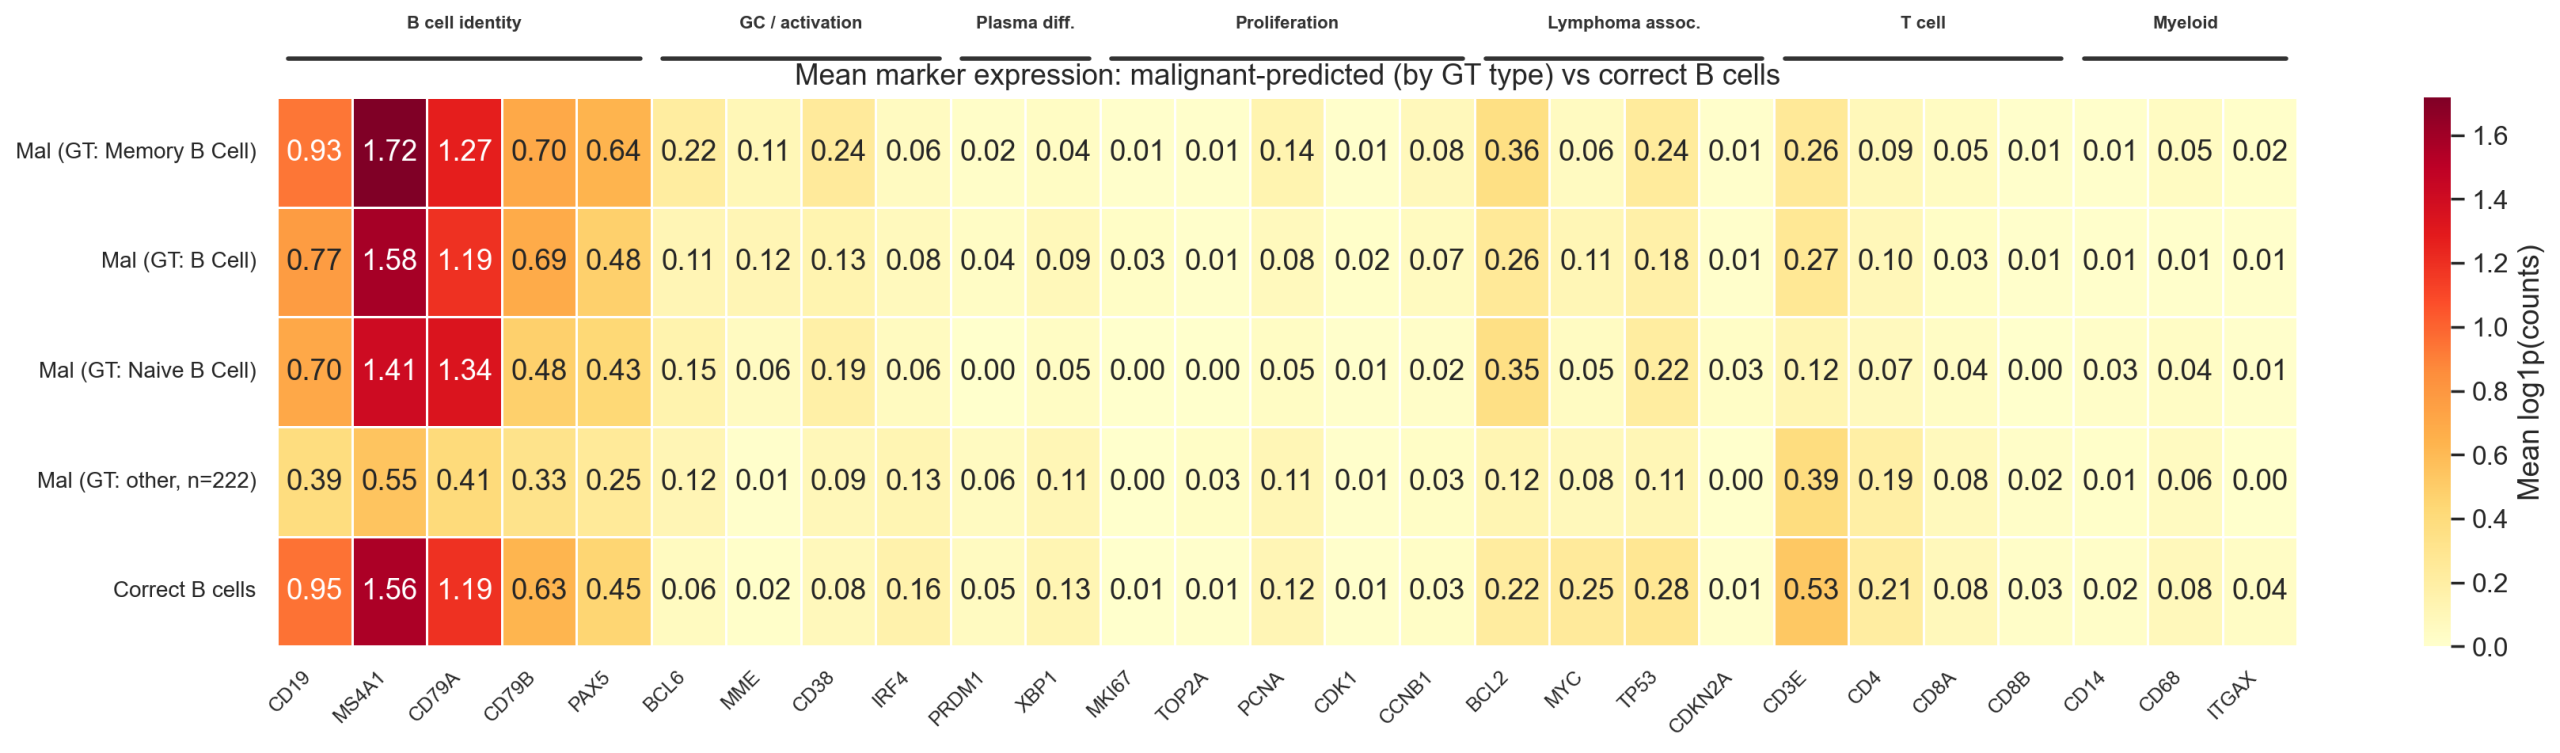
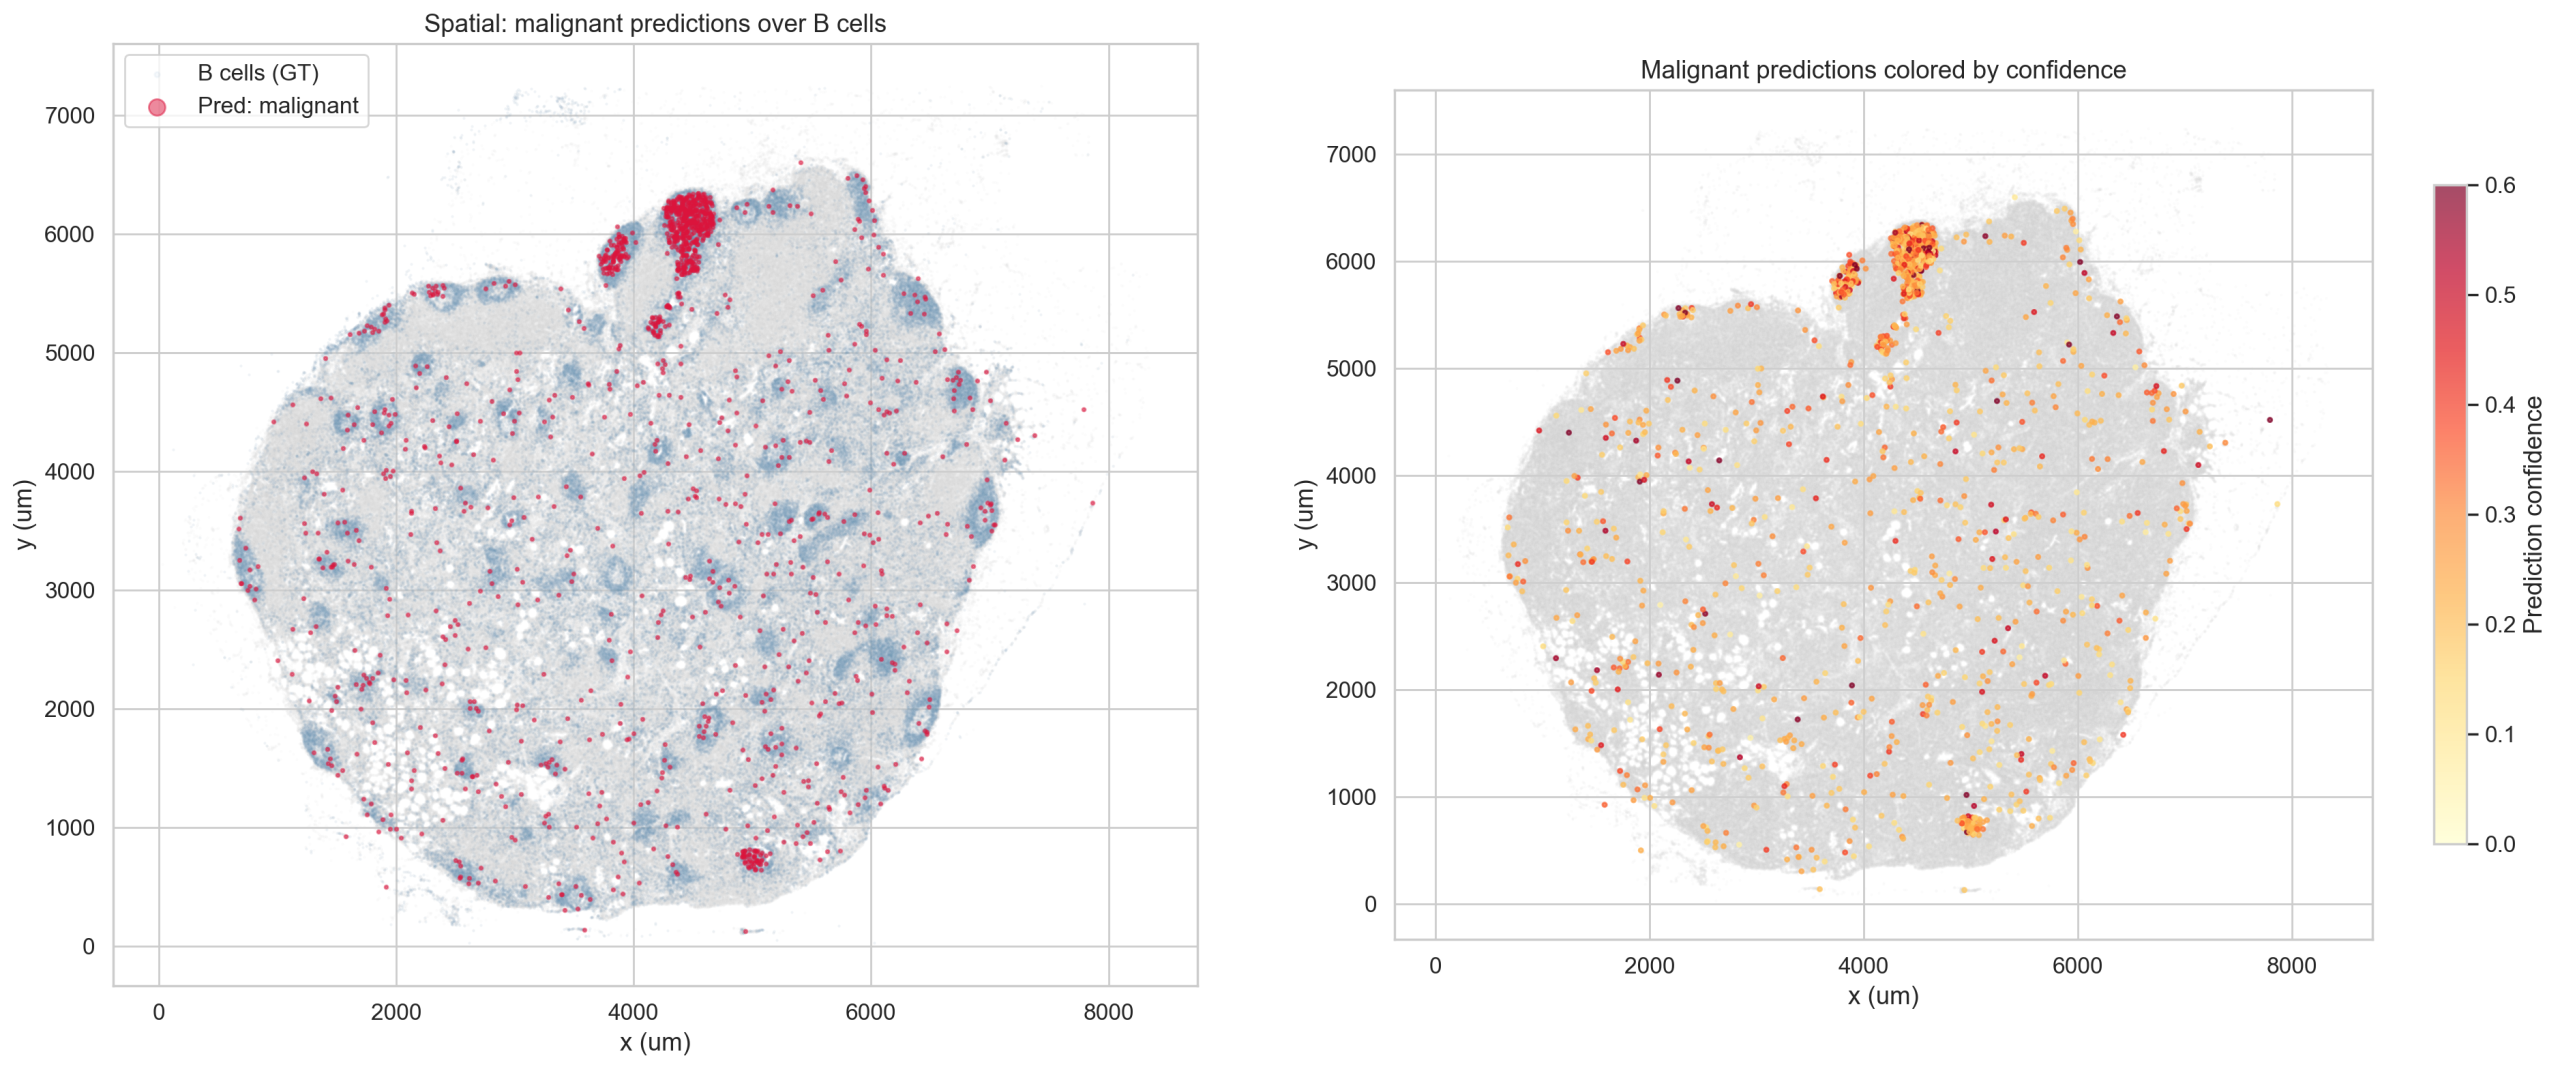
6. Case Study: Malignant Cell Predictions
The model predicts 1,384 cells (0.20%) as “malignant cell” at alpha=0, despite the tissue being a non-neoplastic lymph node. This is the one case where the model prediction appears incorrect. Investigation reveals a segmentation artifact rather than a model failure mode.
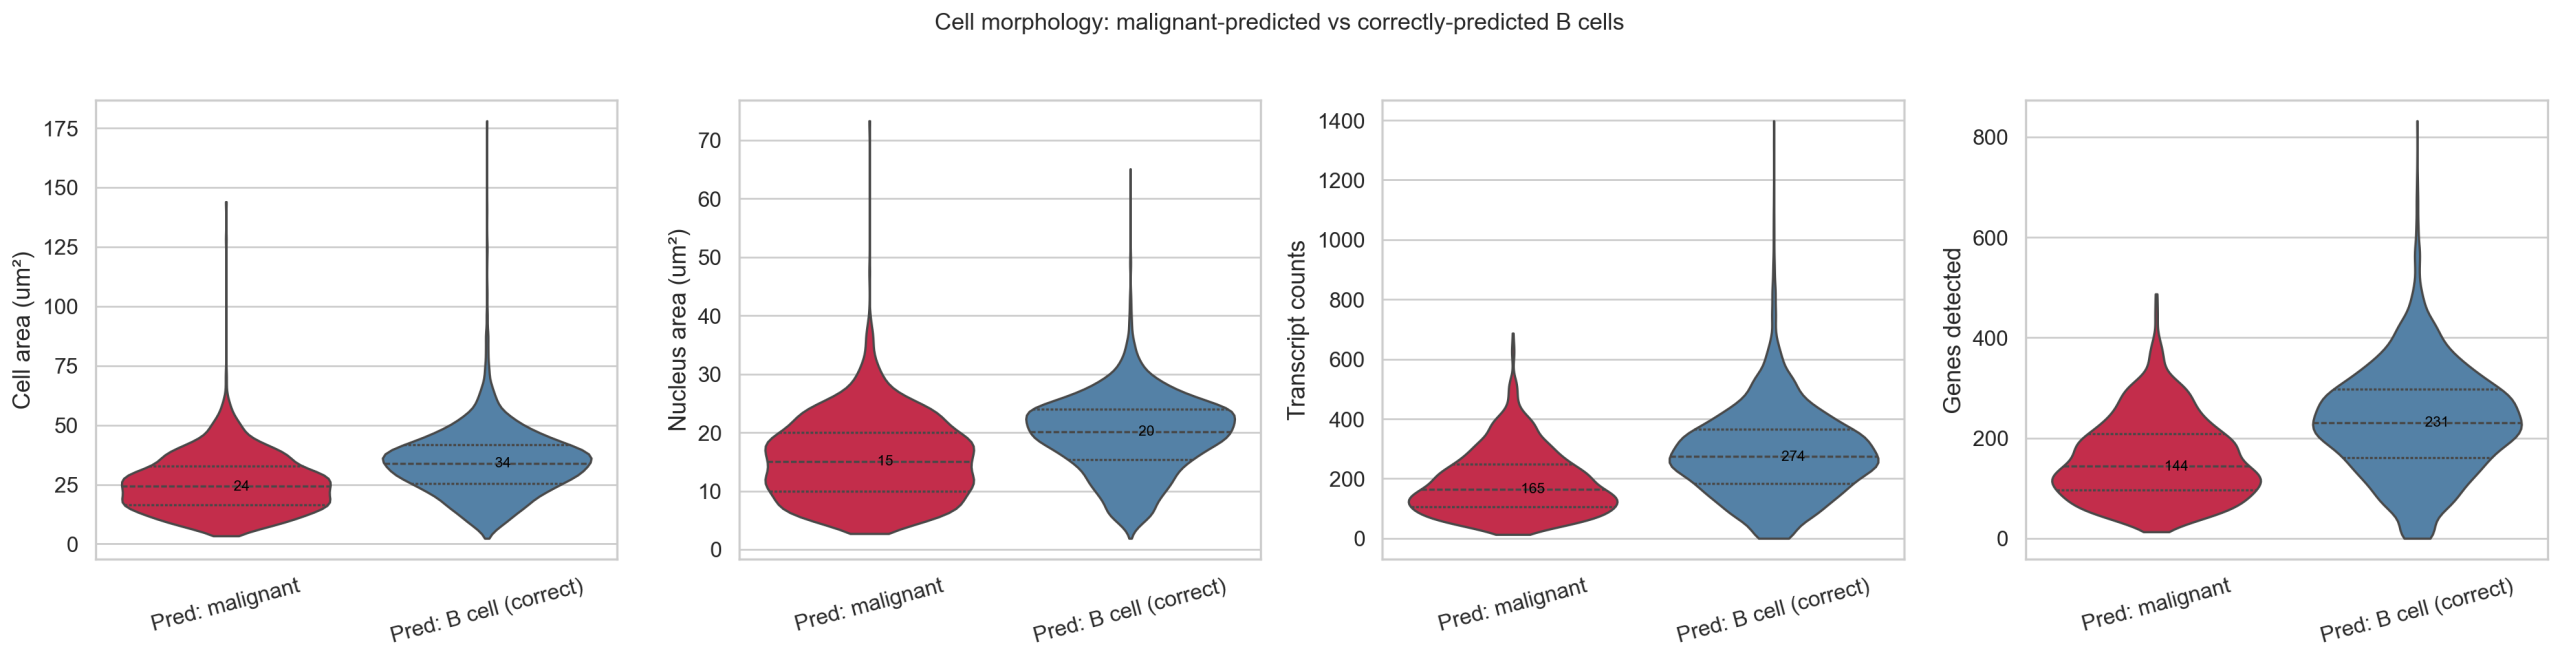
6.1 Malignant-Predicted Cells Are Small B Cells
84% of malignant-predicted cells have B cell author labels (Memory B 62%, B Cell 12%, Naive B 10%). These cells are morphologically distinct from correctly-predicted B cells:
| Metric | Pred: malignant | Pred: B cell (correct) |
|---|---|---|
| Cell area (μm²) | 24.3 | 34.0 |
| Nucleus area (μm²) | 15.1 | 20.1 |
| Transcript counts | 165 | 275 |
| Genes detected | 144 | 231 |
Values are medians. Malignant-predicted cells are 29% smaller with 40% fewer transcripts.
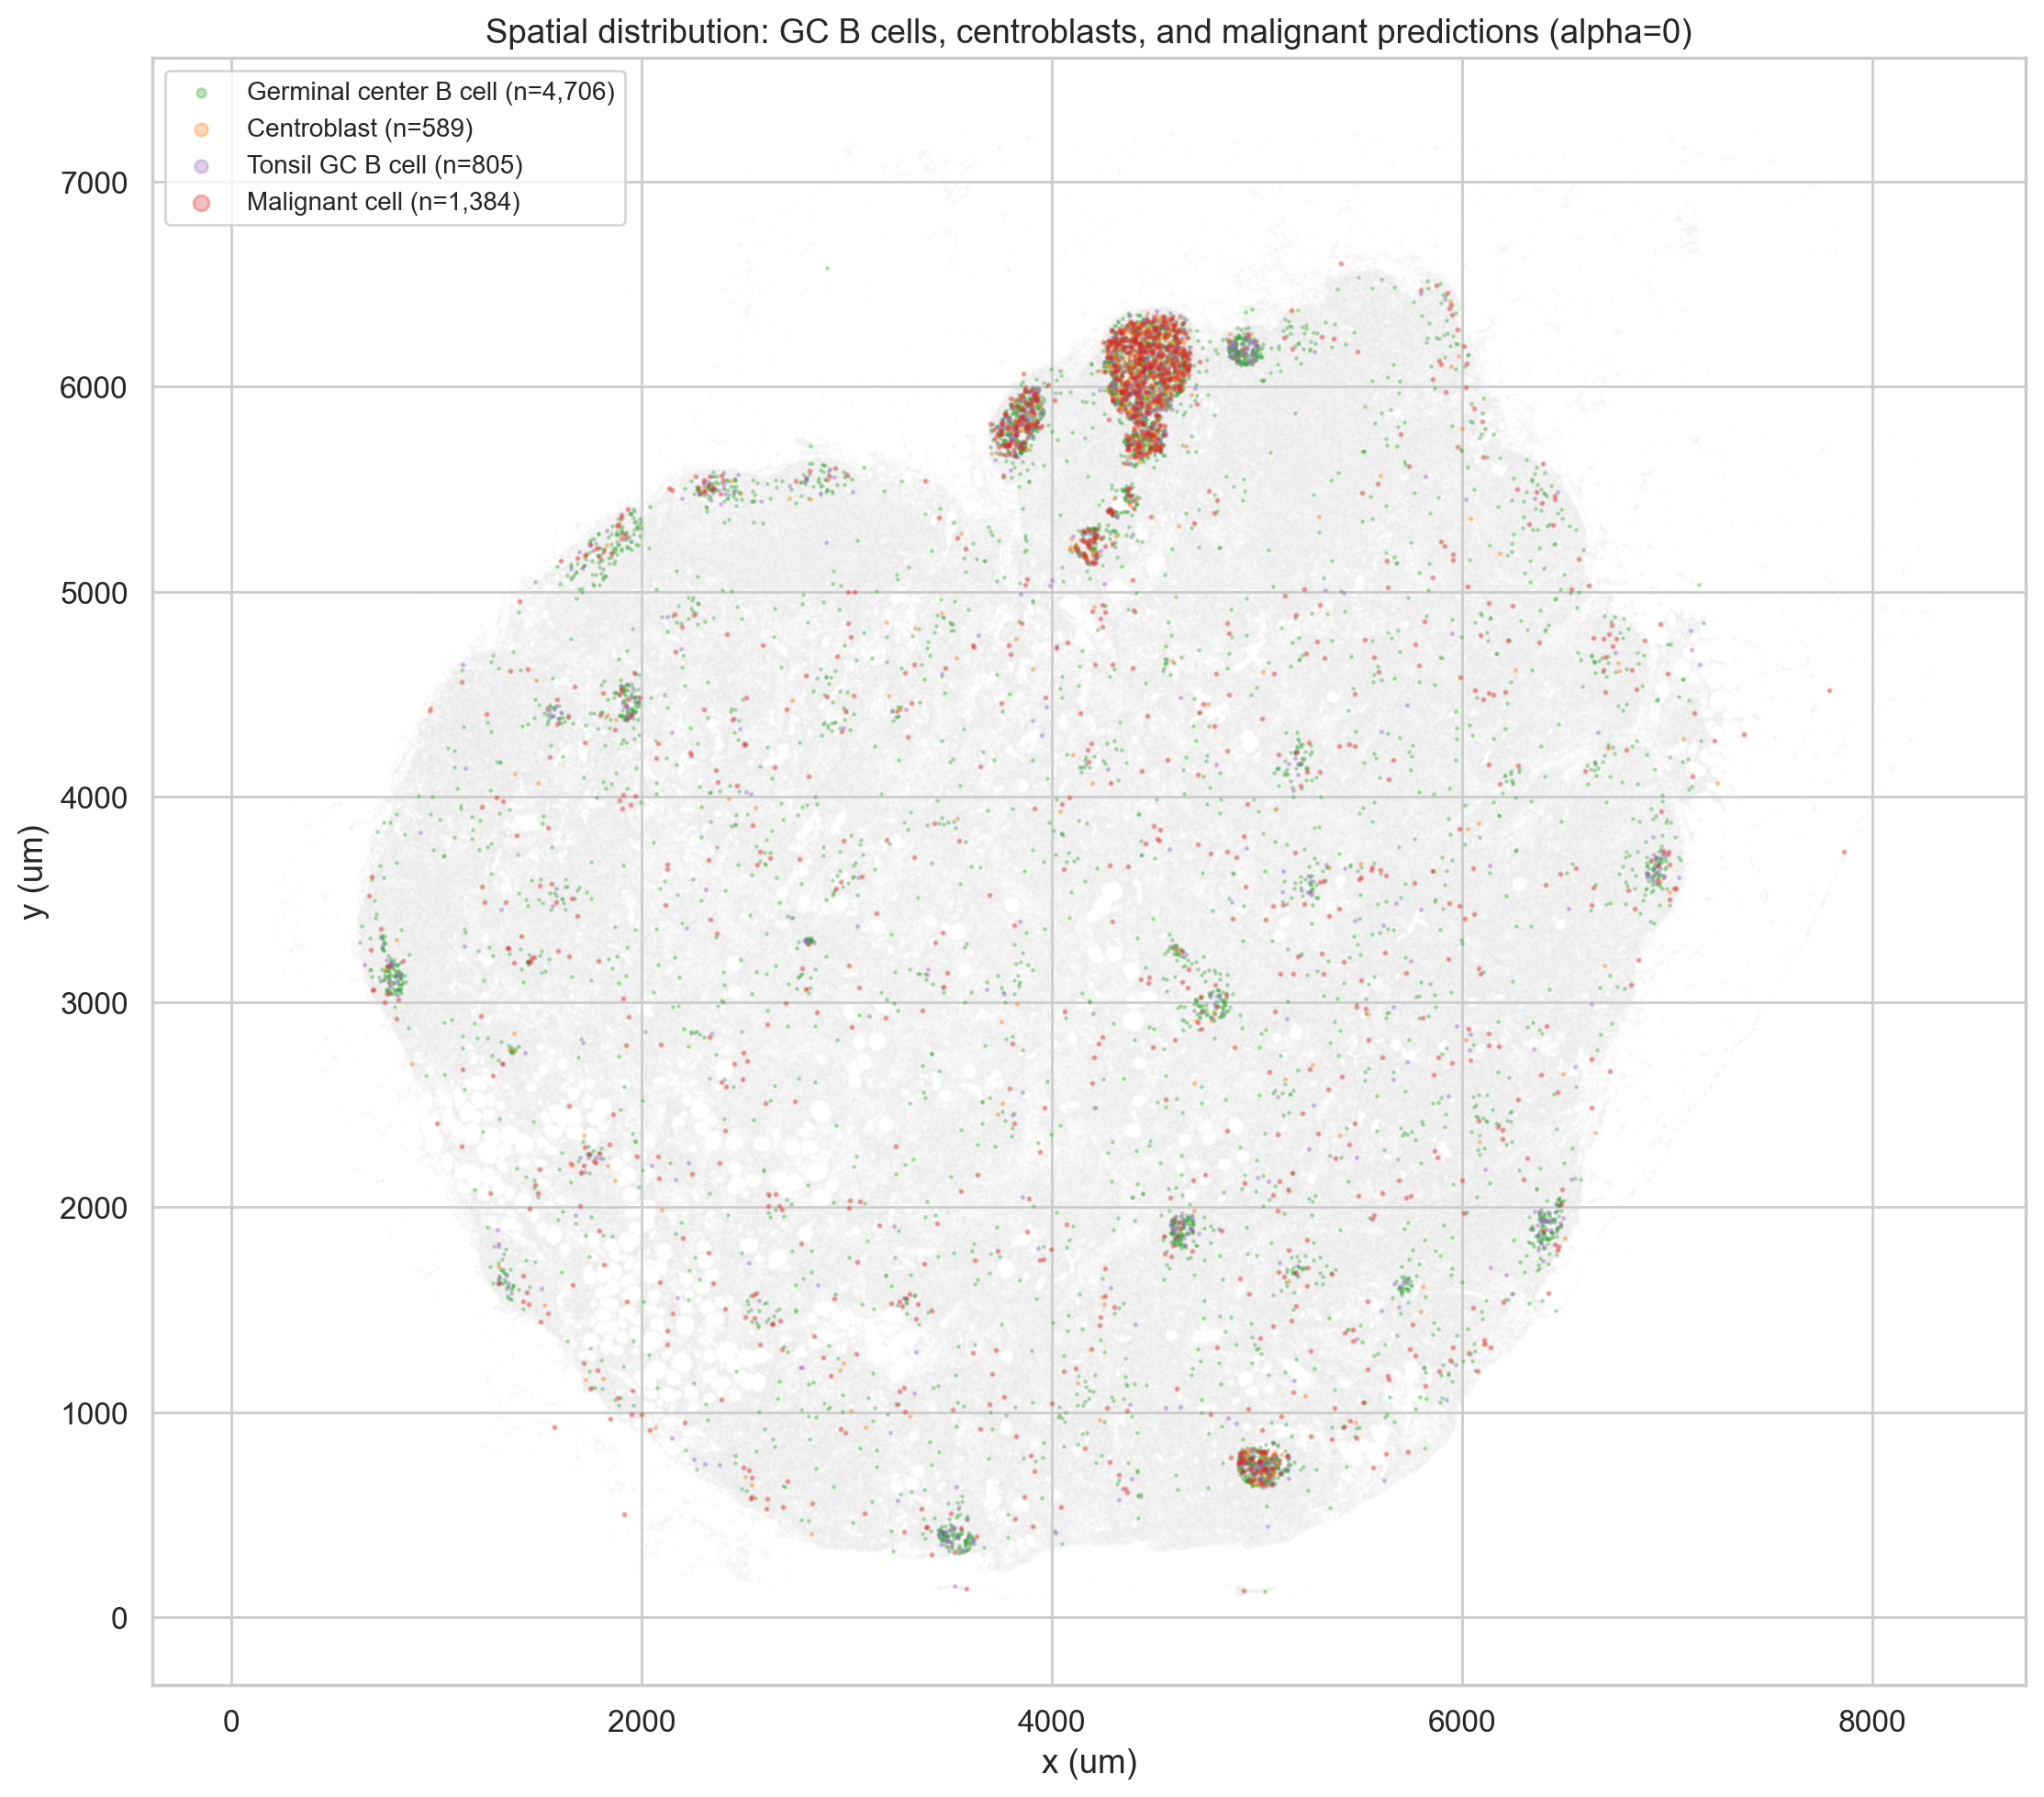
They co-localize spatially with germinal center B cells and have the highest local cell density in the tissue (88 neighbors within 30 μm vs 71 average). Prediction confidence is low (median 0.241), consistent with model uncertainty.
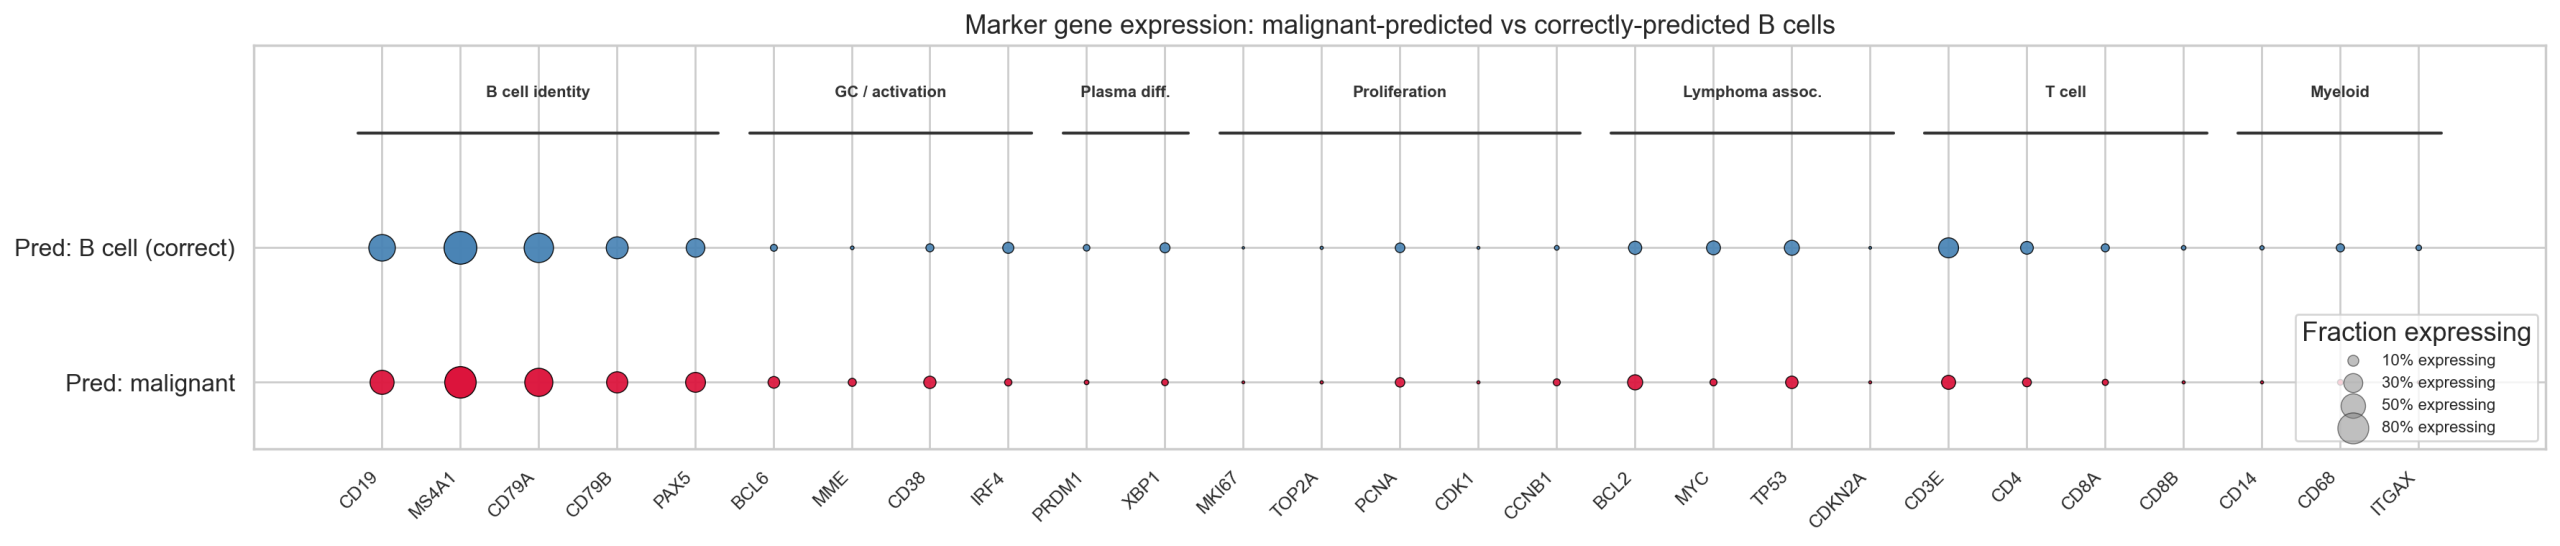
6.2 Marker Expression: Uniformly Depleted, Not Selectively Malignant
Compared to germinal center (GC) B cells, malignant-predicted cells show uniform depletion of nearly all markers (40-70% of GC levels), rather than the selective marker profile expected of a true malignancy. Proliferation markers are essentially absent (MKI67 0.7% vs 12.2% in GC B). The one exception is BCL2, which matches GC levels (19.0% vs 19.0%) — consistent with either a biological transitional state or differential gene depletion (BCL2 is a constitutive marker less affected by boundary effects).
6.3 Differential Downsampling Experiment
Rationale: Uniform transcript downsampling preserves expression ratios and thus embedding direction after L2 normalization — it cannot shift predictions. We instead applied differential downsampling, where each gene’s drop rate is weighted by its vulnerability to segmentation boundary effects.
Vulnerability metric: Per-gene Pearson correlation between raw expression count and cell area across 50K randomly sampled cells. Genes whose counts scale more with cell area have transcripts that are more peripherally localized (more affected by boundary tightening). Top vulnerable genes include membrane/secreted proteins (EEF1G, MYH9, APP, SLC40A1).
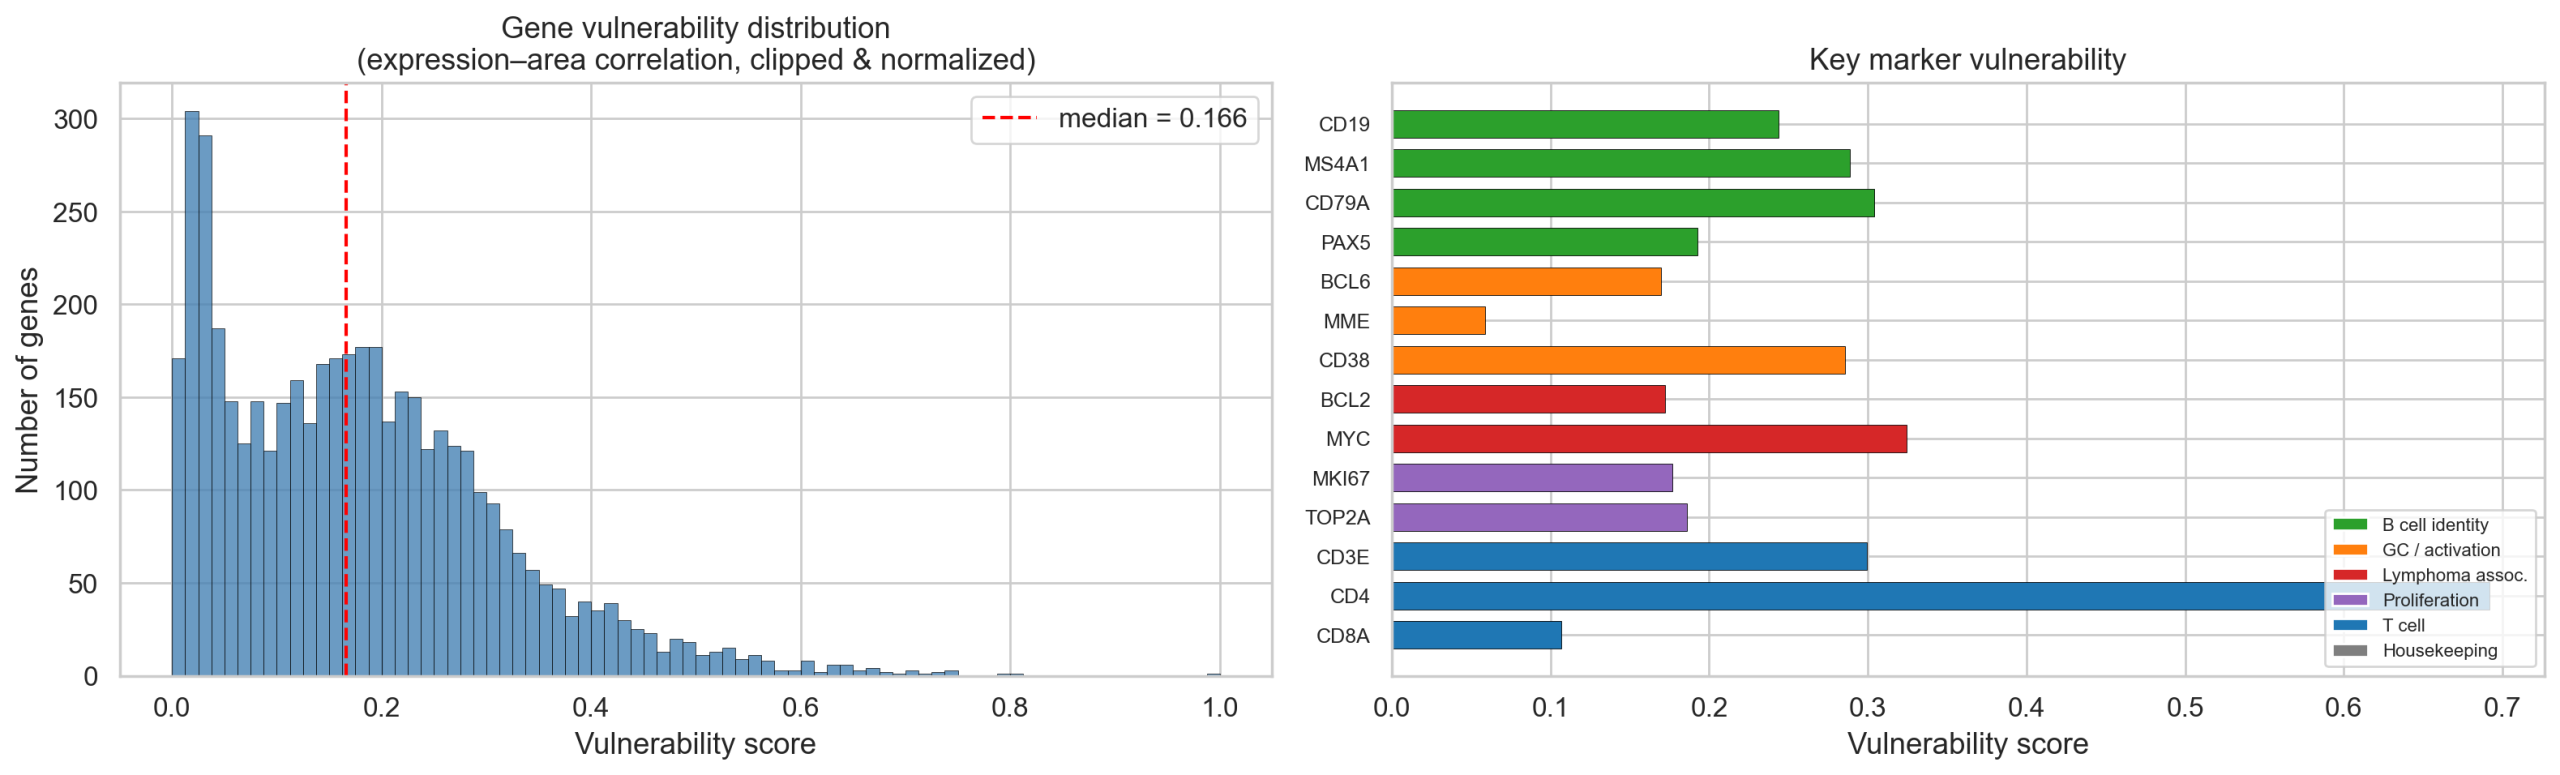
Experiment: For each nominal drop rate (0-60%), per-gene rates are scaled so the mean equals the nominal rate but the distribution follows the vulnerability profile. Each cell group was subsampled to 3,000 cells. Transcript counts were resampled via Binomial(k, 1 − drop_rate_g) per gene, then run through the full inference pipeline (log1p → 3072-dim cell embeddings → L2 normalize → first 500 dims → /0.026 → MLP).
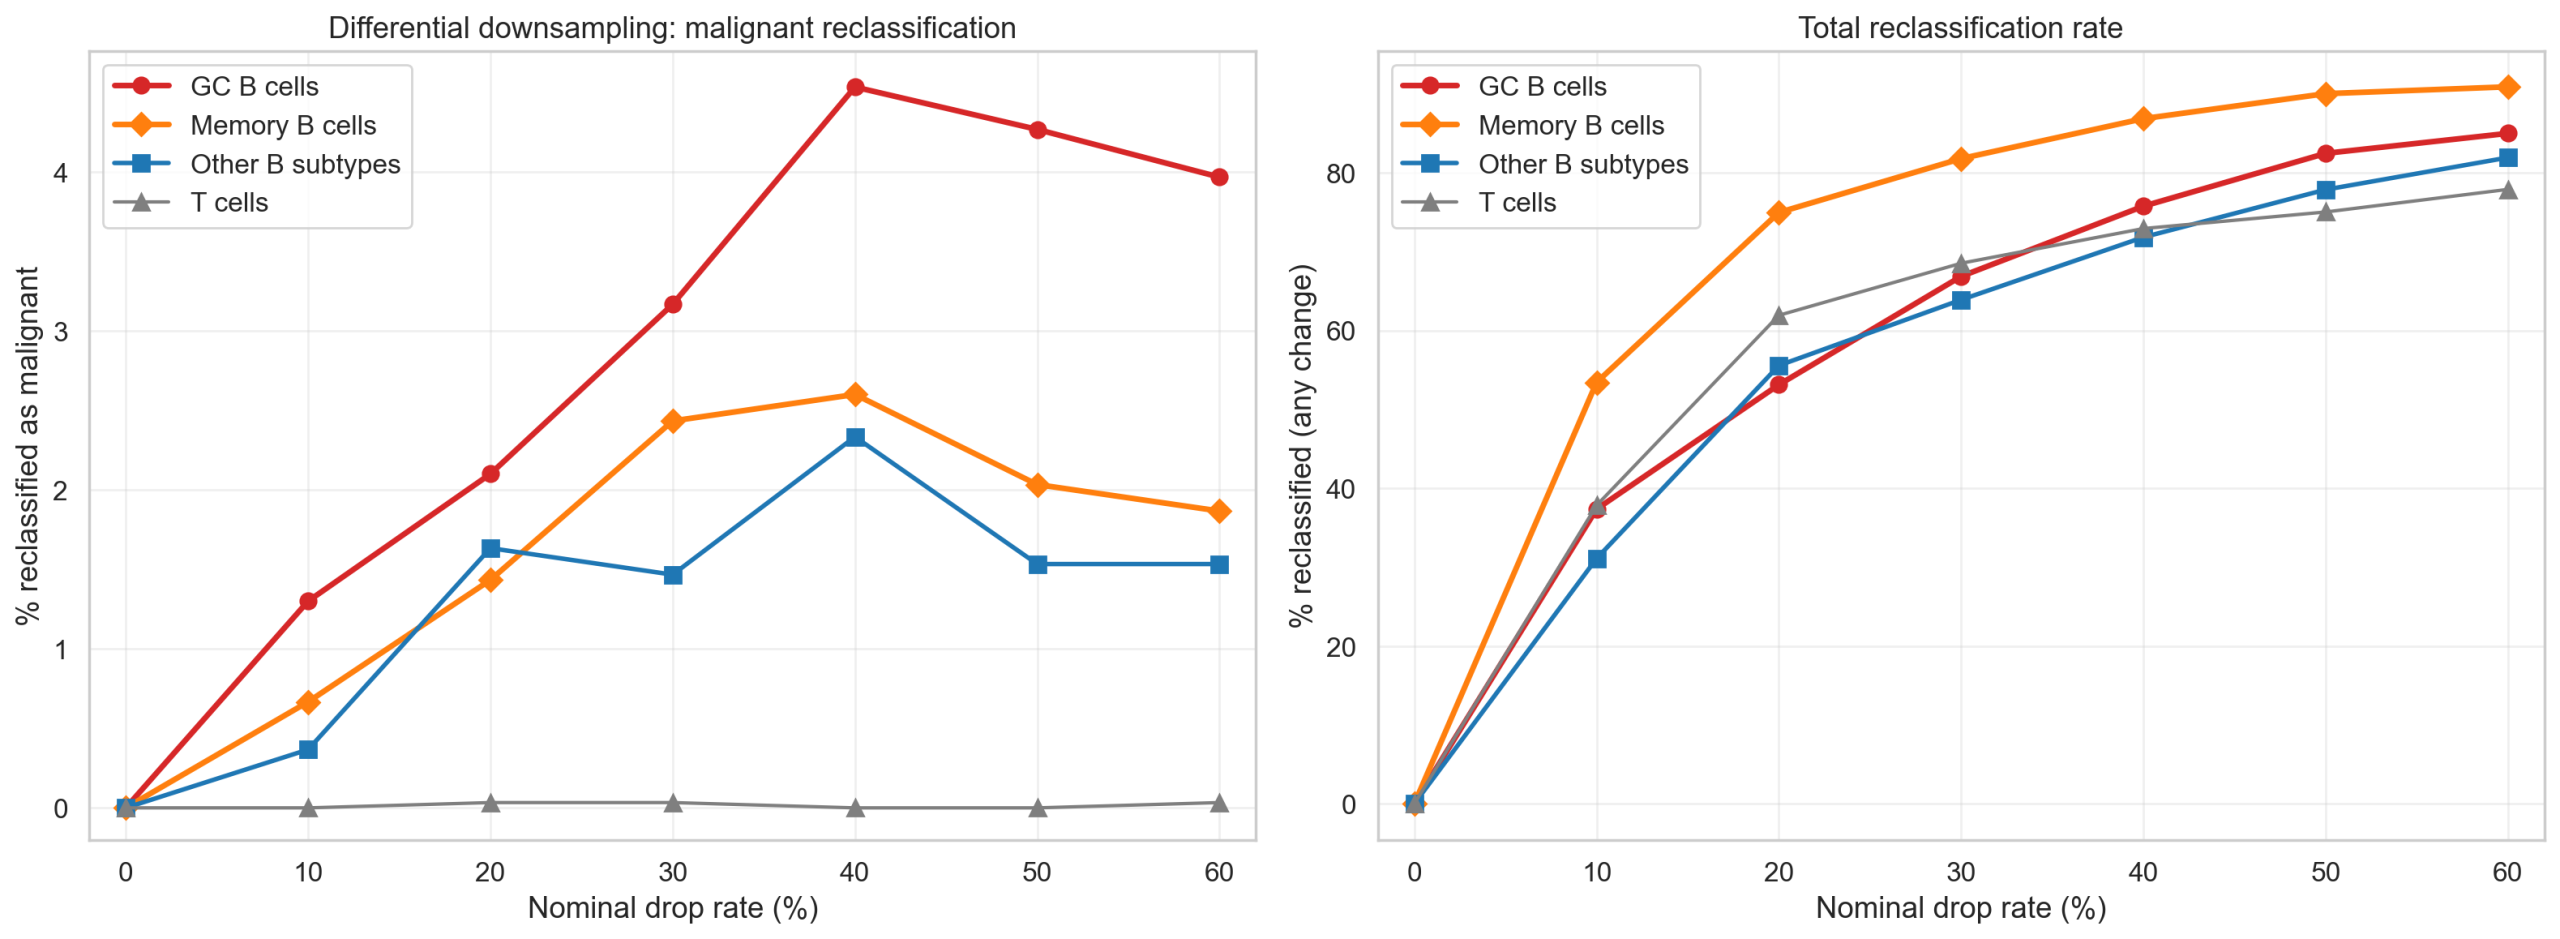
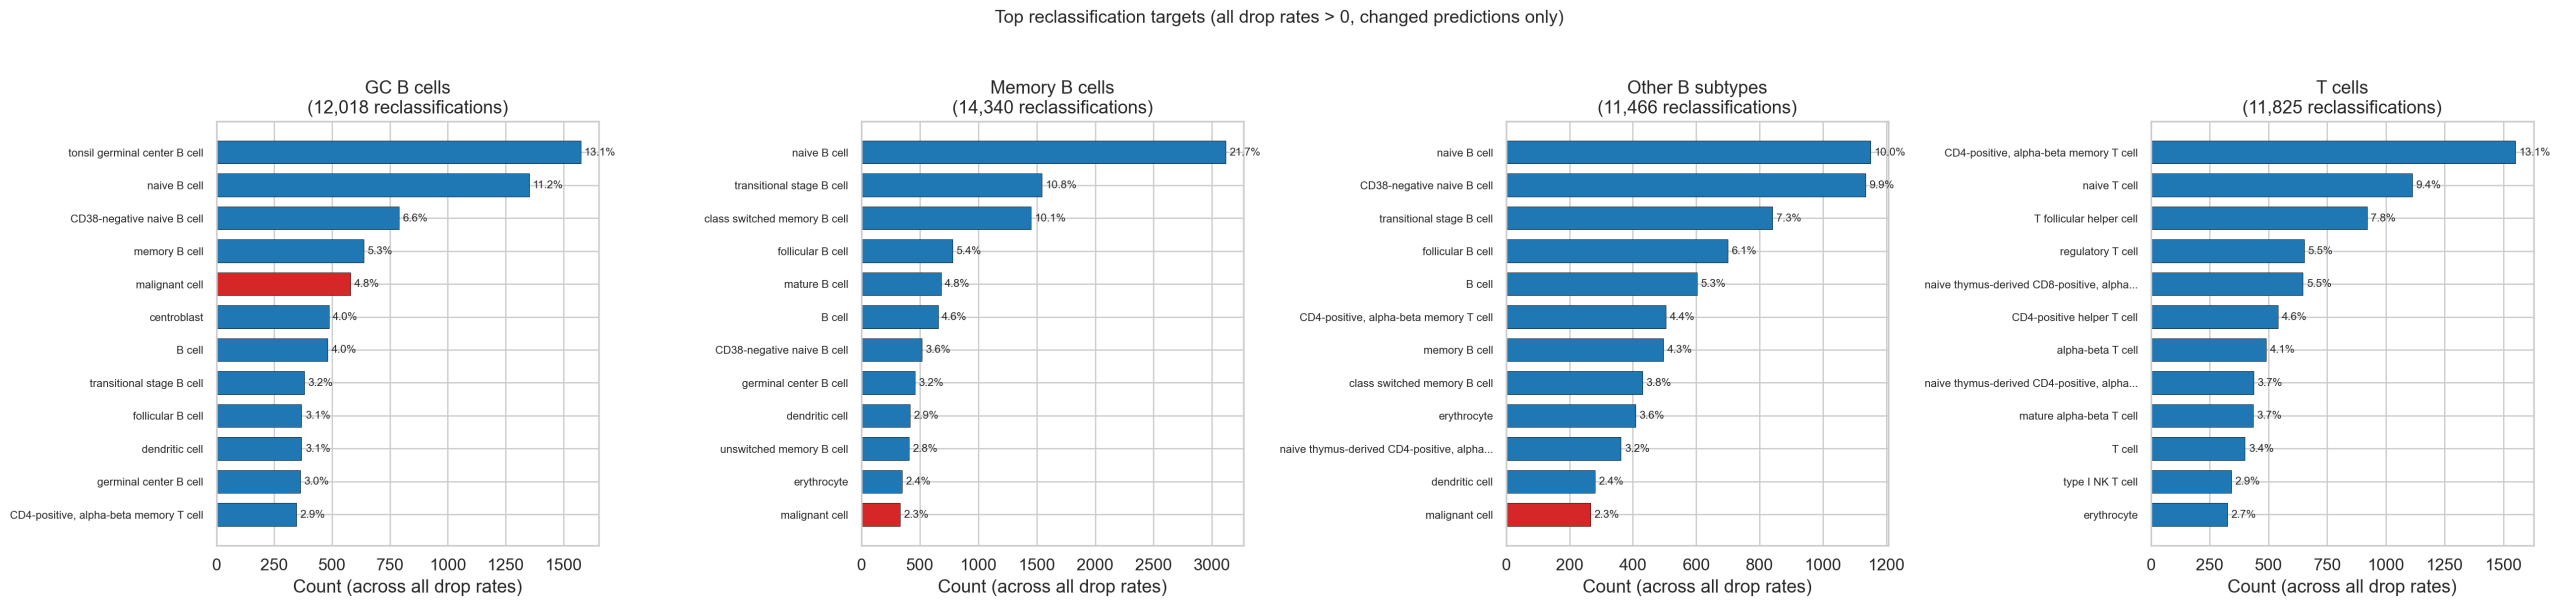
6.4 Dose-Response Results
GC B cells show a clear dose-dependent increase in malignant reclassification. Memory B cells follow at lower magnitude. T cells show essentially zero malignant conversion, confirming the vulnerability is B-cell-specific.
| Drop rate | GC B cells | Memory B cells | Other B subtypes | T cells |
|---|---|---|---|---|
| 0% | 0.00% | 0.00% | 0.00% | 0.00% |
| 10% | 1.30% | 0.67% | 0.37% | 0.00% |
| 20% | 2.10% | 1.43% | 1.63% | 0.03% |
| 30% | 3.17% | 2.43% | 1.47% | 0.03% |
| 40% | 4.53% | 2.60% | 2.33% | 0.00% |
| 50% | 4.27% | 2.03% | 1.53% | 0.00% |
| 60% | 3.97% | 1.87% | 1.53% | 0.03% |
6.5 Implied Drop Rate
Applying the per-group conversion rates to the full population sizes (6,100 GC B; 11,171 Memory B; 136,210 other B; 183,590 T cells), ~14% differential transcript depletion would produce the observed 1,384 malignant predictions. This is physically plausible for cells in dense lymphoid follicles: losing ~1 in 7 transcripts to neighbors, biased toward peripherally-localized genes.
| Drop rate | Expected malignant | vs. observed 1,384 |
|---|---|---|
| 10% | 653 | 0.5x |
| ~14% | ~1,384 | 1.0x |
| 20% | 2,574 | 1.9x |
6.6 Interpretation
The malignant predictions are a segmentation artifact, not a model failure. Five lines of evidence converge:
- Dose-dependent: Differential transcript depletion produces malignant reclassification in B cells with a clear dose-response curve
- B-cell-specific: T cells are unaffected — the effect requires B cell expression signatures
- Morphologically consistent: Malignant-predicted cells are the smallest (24.3 μm²) with fewest transcripts (165), matching the segmentation artifact profile
- Spatially consistent: Co-localization with germinal center B cells, the densest tissue regions
- Quantitatively plausible: ~14% differential depletion reproduces the observed count
The effect is real but modest: even at 40% depletion, only ~5% of GC B cells convert to malignant. The shared expression signatures between GC B cells and malignant cells (proliferation markers, BCL2/BCL6) likely lower the decision boundary, making these predictions particularly sensitive to transcript loss.
6.7 Dedicated Malignant Classifier
The analysis above uses the general 425-type cell type classifier’s “malignant cell” output. As an independent check, we ran a dedicated binary malignant classifier (v1.1, panel-specific Xenium 5K model, test F1=0.97, PR-AUC=0.998) trained specifically to distinguish malignant from non-malignant cells.
The dedicated classifier flags 50 cells (0.007%) at threshold 0.5 — a 28-fold reduction from the 1,384 flagged by the general model. The two classifiers identify completely non-overlapping cell sets: none of the 50 dedicated-classifier calls appear in the general model’s 1,384, and vice versa.
| General classifier | Dedicated classifier | |
|---|---|---|
| Cells flagged | 1,384 | 50 |
| Median confidence | 0.241 | 0.605 |
| GT: B cell types | 84% | 84% (42/50) |
| CT classifier prediction | “malignant cell” | cardiac neuron (72%), erythrocyte (8%), ionocyte (8%) |
Unlike the general model’s dense B-cell-zone hotspots, most of the dedicated classifier’s 50 cells sit at or beyond the tissue edge: 78% fall in the lowest-density quartile of the tissue (median 346 neighbors within 100 μm vs 768 tissue-wide), and 56% lie beyond the 90th-percentile radius from the tissue centroid. The general cell type classifier calls these same cells “cardiac neuron” (36), “erythrocyte” (4), and “ionocyte” (4) — cell types absent from lymph node — confirming they have garbled transcriptomes that confuse both classifiers in different ways. 42 of 50 are author-labeled B cells.
6.8 Conclusion
Two independent classifiers — a 425-type general model and a dedicated binary malignant detector — both flag small numbers of cells in this non-neoplastic lymph node, but they identify completely different populations through different mechanisms. The general model’s 1,384 calls are transcript-depleted B cells in the densest tissue regions; the dedicated classifier’s 50 calls are edge cells with garbled profiles. Neither set likely represents true malignancy. Improving cell segmentation — particularly in dense follicles and at tissue boundaries — would likely eliminate both.
7. Spatial Tissue Architecture Coherence (STAC)
7.1 Motivation
Sections 1-6 validate MiraTyper through marker gating, hierarchical gating, and deep dives into specific error modes. All of these approaches ultimately depend on some form of ground truth or reference standard. Spatial transcriptomics data offers a fundamentally different validation axis: which annotation set produces more biologically coherent tissue architecture?
Neither annotation method used spatial coordinates as input — author labels came from Leiden clustering on expression, model labels from gene embeddings + tissue prior on expression. If model labels produce neighborhoods and zones that better match known lymph node microanatomy, that’s strong evidence for model accuracy without any ground truth. This analysis computes spatial coherence metrics under both model and author labels at matched resolution and compares them head-to-head.
7.2 Resolution Matching
Model predicts 425 types; author uses 28. Raw neighborhood type agreement at fine resolution trivially favors author labels (fewer types → more same-type neighbors). All comparisons operate at matched resolution:
- Broad lineage (15 categories):
author_broadvsmodel_broad— both derived from the same broad lineage mapping - 28-type level:
gt_cell_type(author) vsmodel_mapped(model predictions mapped to 28 types via Jaccard nearest-neighbor on Cell Ontology ancestors)
model_broad includes 66,984 “Other” cells (9.4%) with no broad lineage match, which penalizes the model’s ENS score (see Section 7.3).
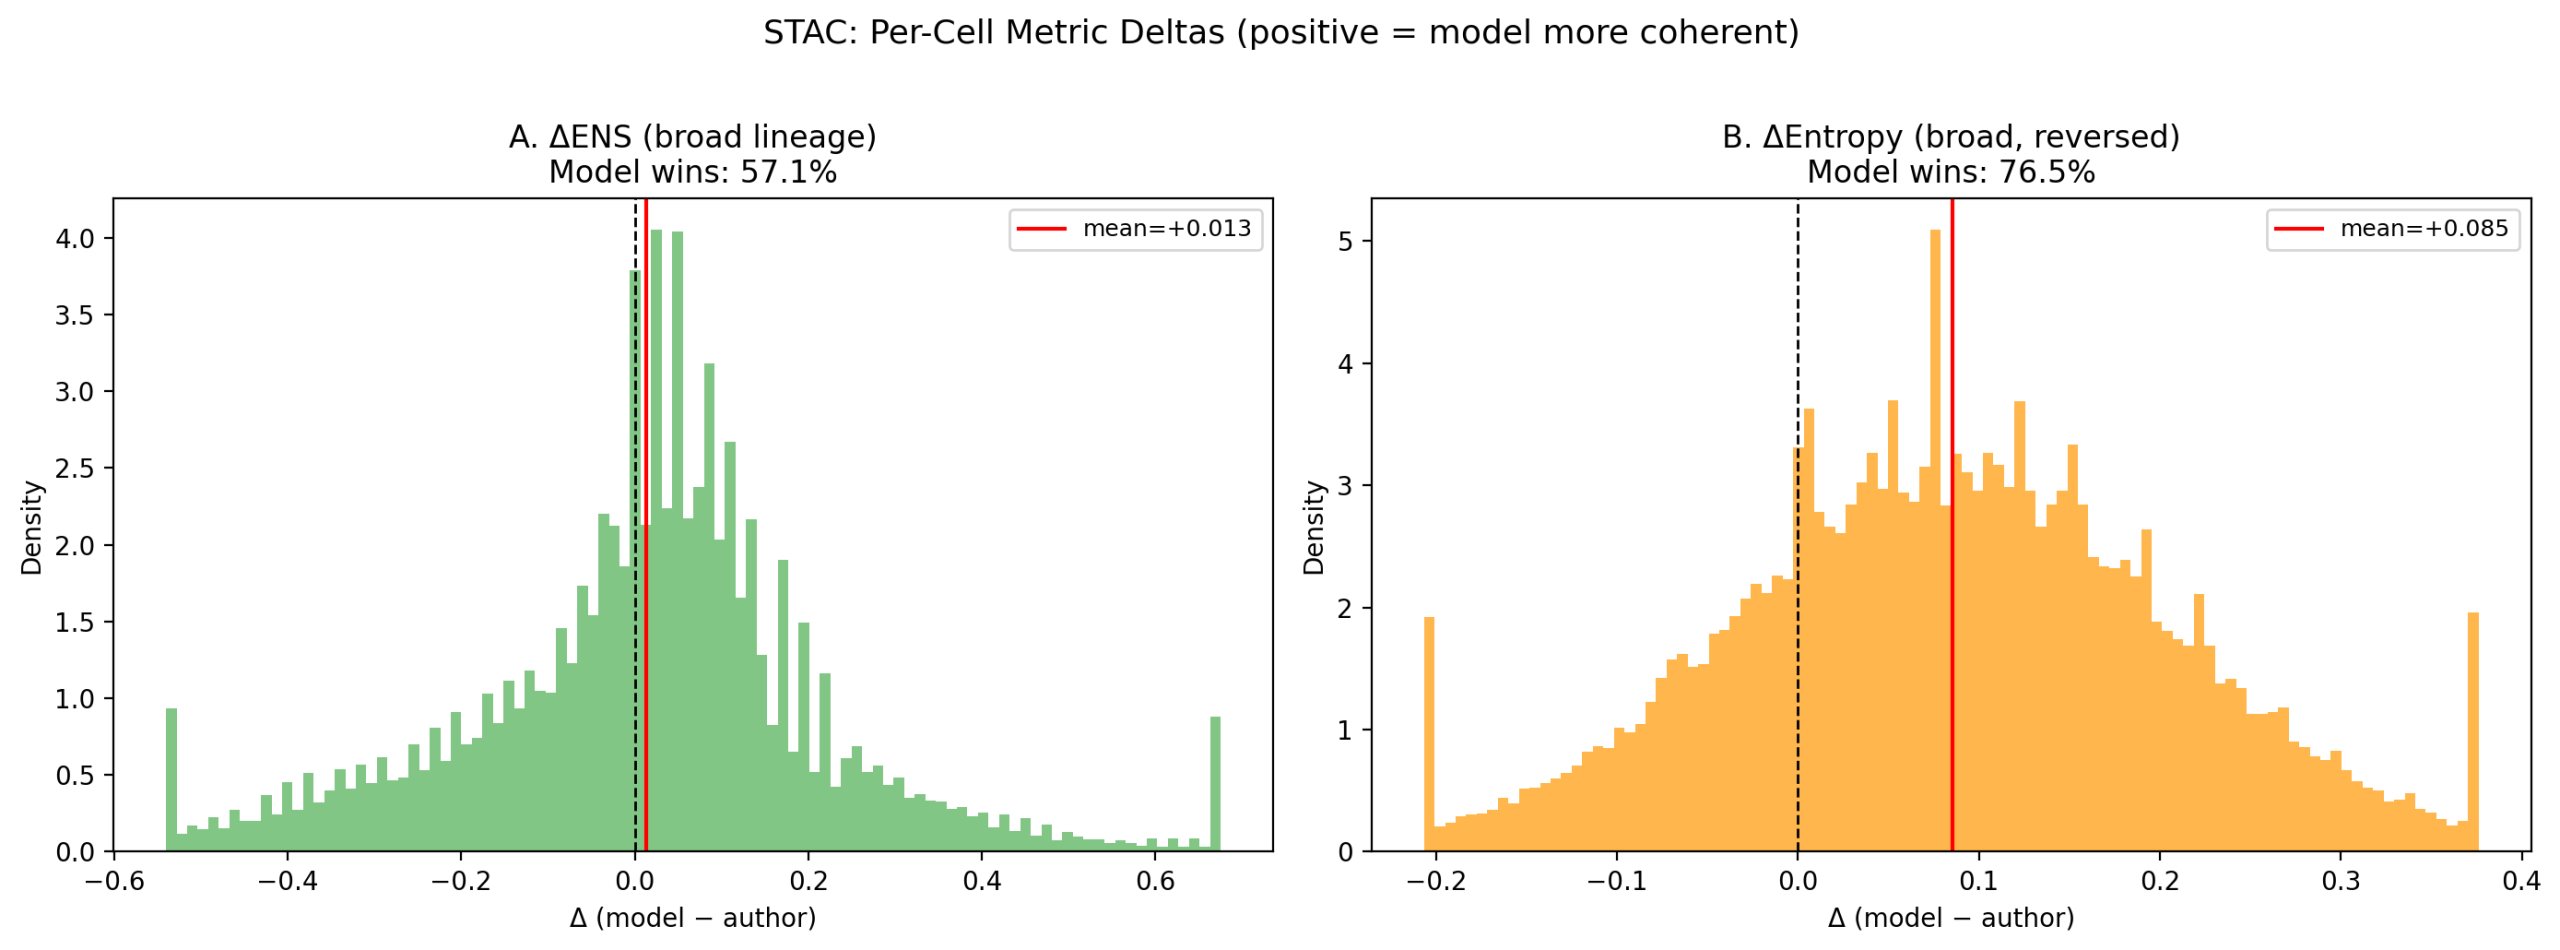
7.3 Per-Cell Metrics
Two metrics were computed for all 708,983 cells under both label sets using k=20 spatial neighbors within 50 μm (cKDTree, same pattern as spatial_confidence.ipynb):
- ENS (Expected Neighbor Score): Biological co-location prior matrix C[a,b] ∈ {0, 0.5, 1.0} encoding textbook lymph node microanatomy (not fitted to data)
- Normalized entropy: H / log₂(n_types); lower = more organized neighborhoods
| Metric | δ mean | Frac. model wins | Cohen’s d | Interpretation |
|---|---|---|---|---|
| δENS | +0.014 | 57.1% | +0.062 | Small model advantage |
| δEntropy (broad) | +0.085 | 76.5% | +0.695 | Medium-large model advantage |
δ = model − author. Positive δENS favors model; positive δEntropy means author neighborhoods are more disordered (model advantage).
Neighborhood entropy is the clearest signal: 76.5% of cells have lower entropy (more organized neighborhoods) under model labels, with a medium-large effect size (d=0.70). ENS shows a smaller but consistent model advantage (57.1% of cells, d=0.06). The ENS advantage triples (mean δENS +0.014 → +0.048) when excluding the 66,984 “Other” cells (9.4%) whose fine-grained model predictions don’t map to any broad lineage and receive a below-neutral ENS score by design.
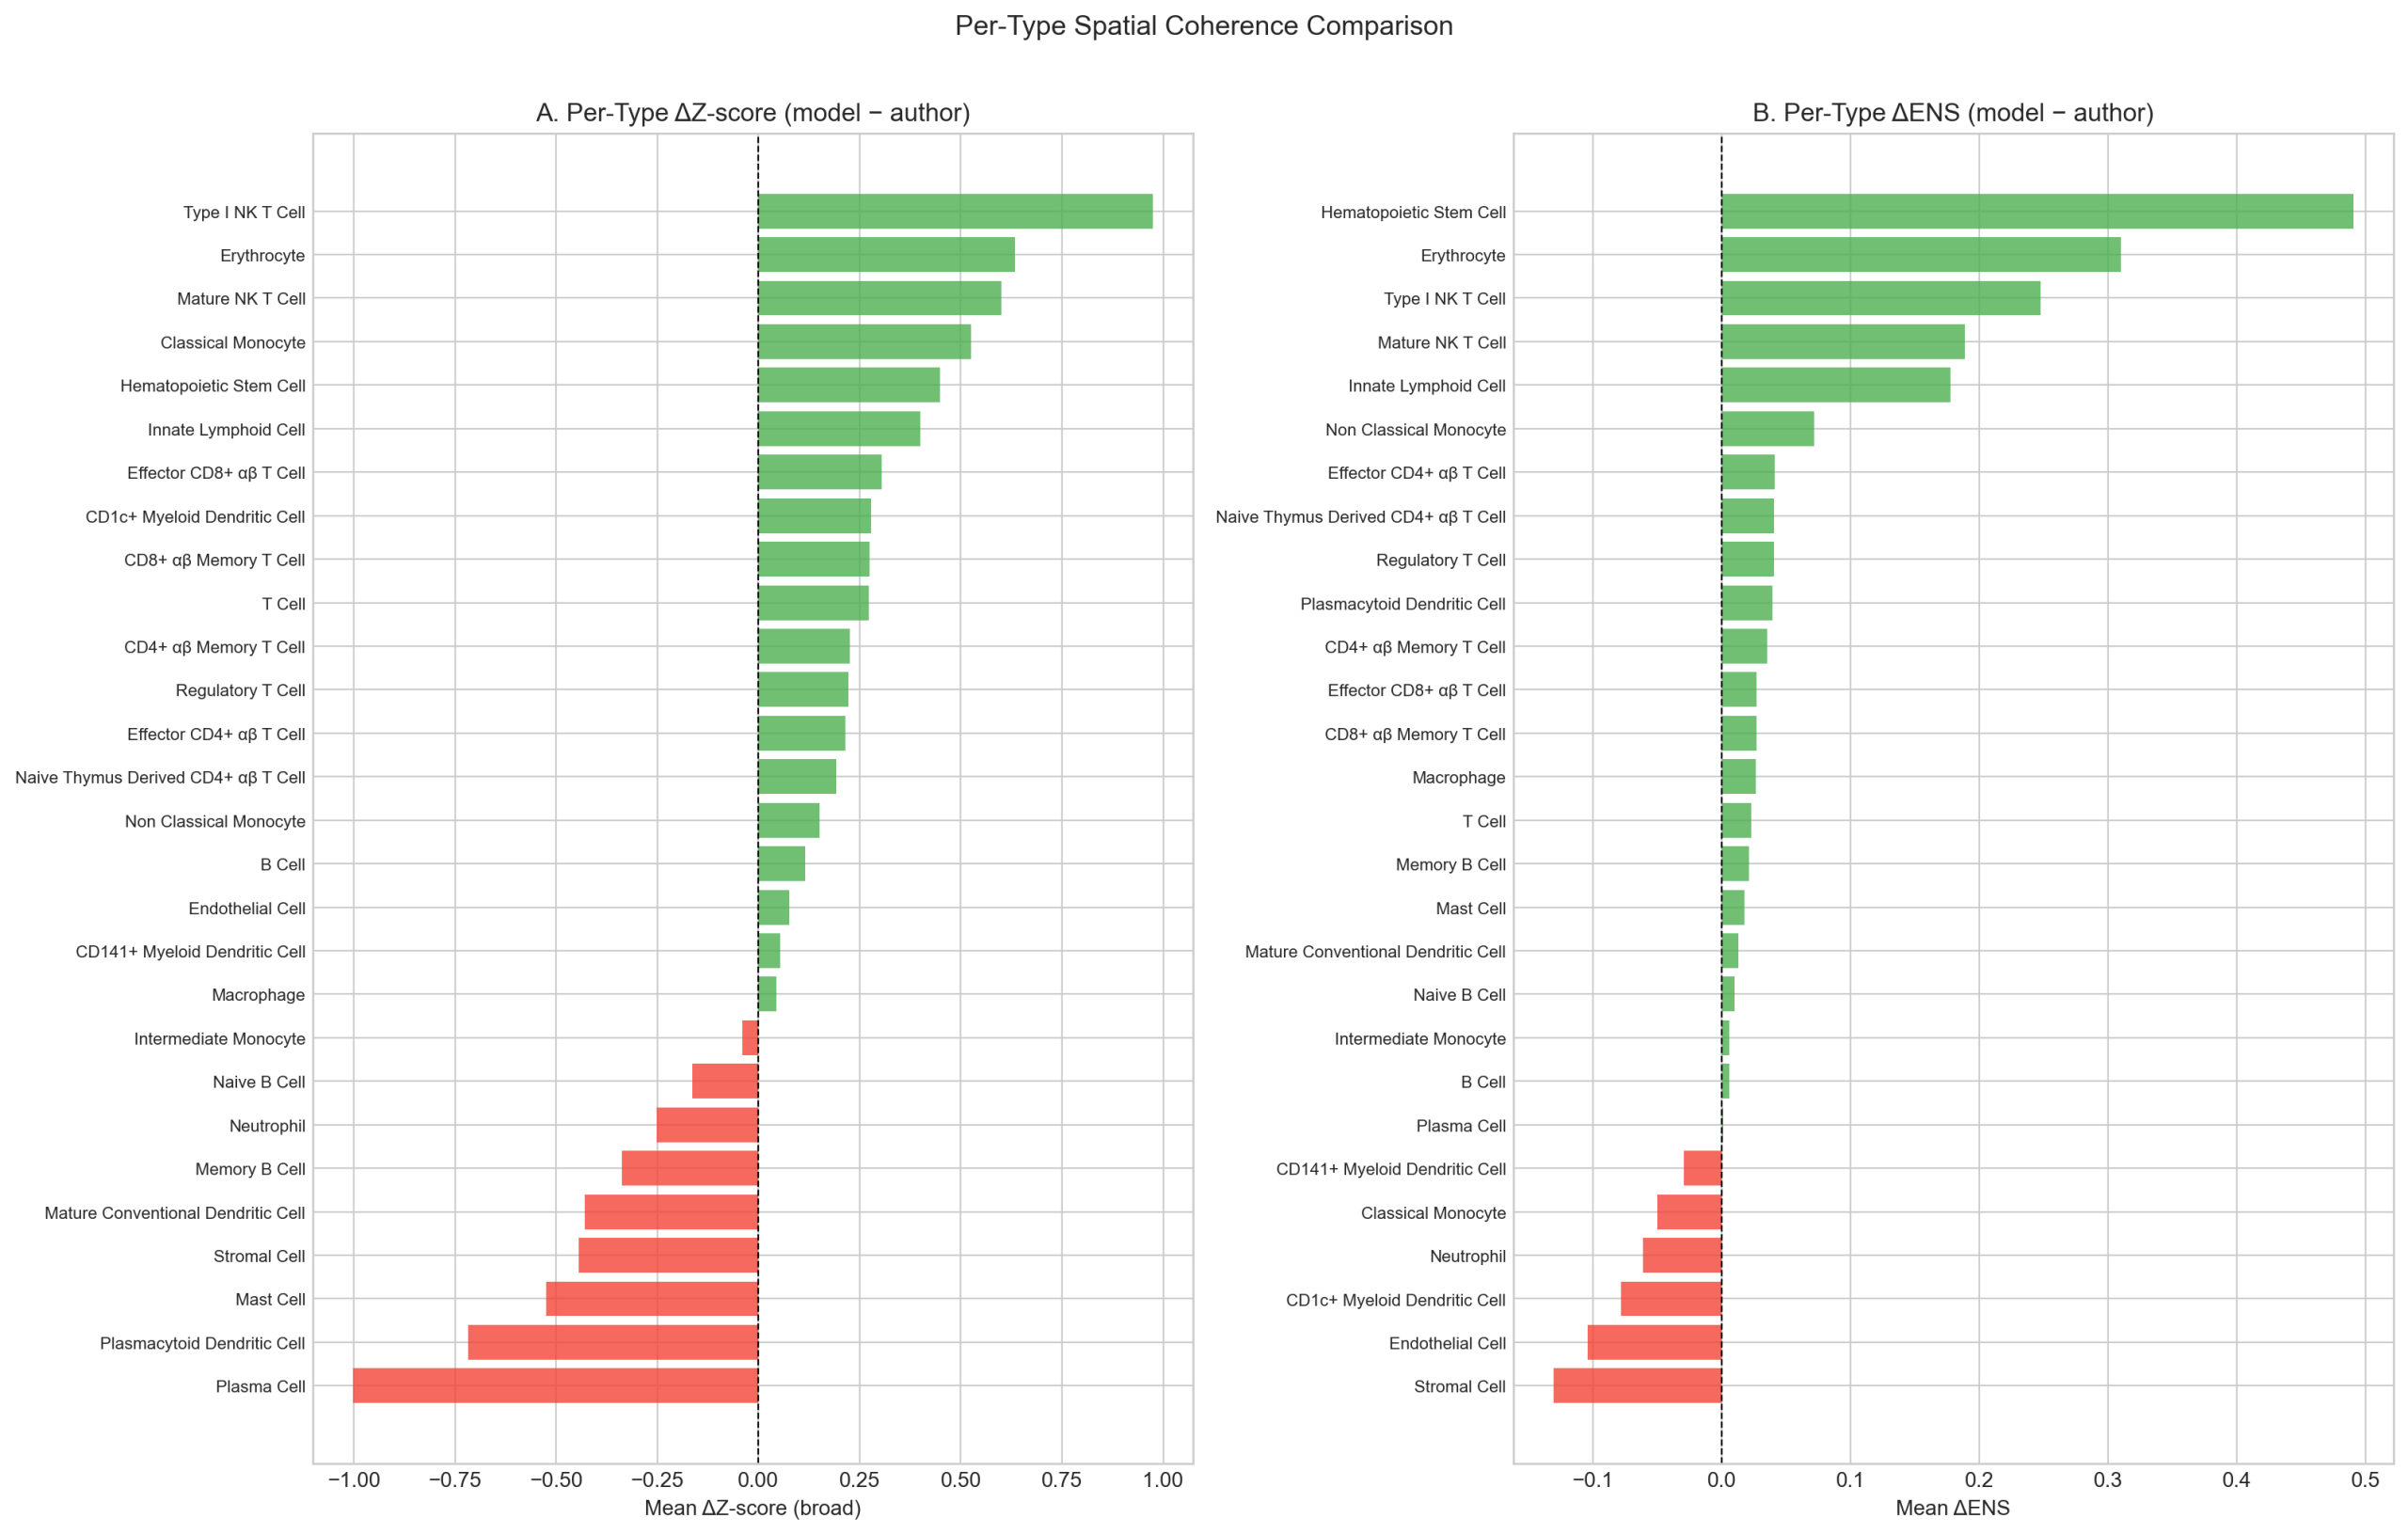
7.4 Per-Type Breakdown
Grouping by author cell type reveals where each label set is stronger:
| Author type | n cells | Mean δENS | Frac. model wins ENS | Interpretation |
|---|---|---|---|---|
| HSC | 24,642 | +0.491 | 94.6% | Known Leiden artifact (Section 5) |
| Erythrocyte | 591 | +0.310 | 85.8% | Model tightens rare type |
| Type I NKT | 1,747 | +0.248 | 89.0% | Model resolves rare type spatially |
| ILC | 31,405 | +0.178 | 85.4% | Author over-labels (Section 5) |
| Naive CD4 T | 62,350 | +0.040 | 74.8% | Model corrects scatter (Section 5) |
| pDC | 15,152 | +0.039 | 71.7% | Model advantage |
| Plasma | 24,775 | +0.001 | 38.4% | Author advantage (ENS) |
| Stromal | 58,591 | −0.131 | 25.7% | Author advantage |
The model’s largest per-type advantages are in populations previously identified as annotation errors: HSC (94.6% of cells have better ENS under model labels, consistent with Section 5’s finding that the entire HSC cluster is an artifact), ILC (85.4%, consistent with Section 5’s misannotation finding), and Naive CD4 T (74.8%, consistent with the “vertical line” pattern in Section 5). Author advantages concentrate in plasma cells (ENS) and stromal cells, where the author’s coarser labels may group spatially co-located subtypes that the model separates.
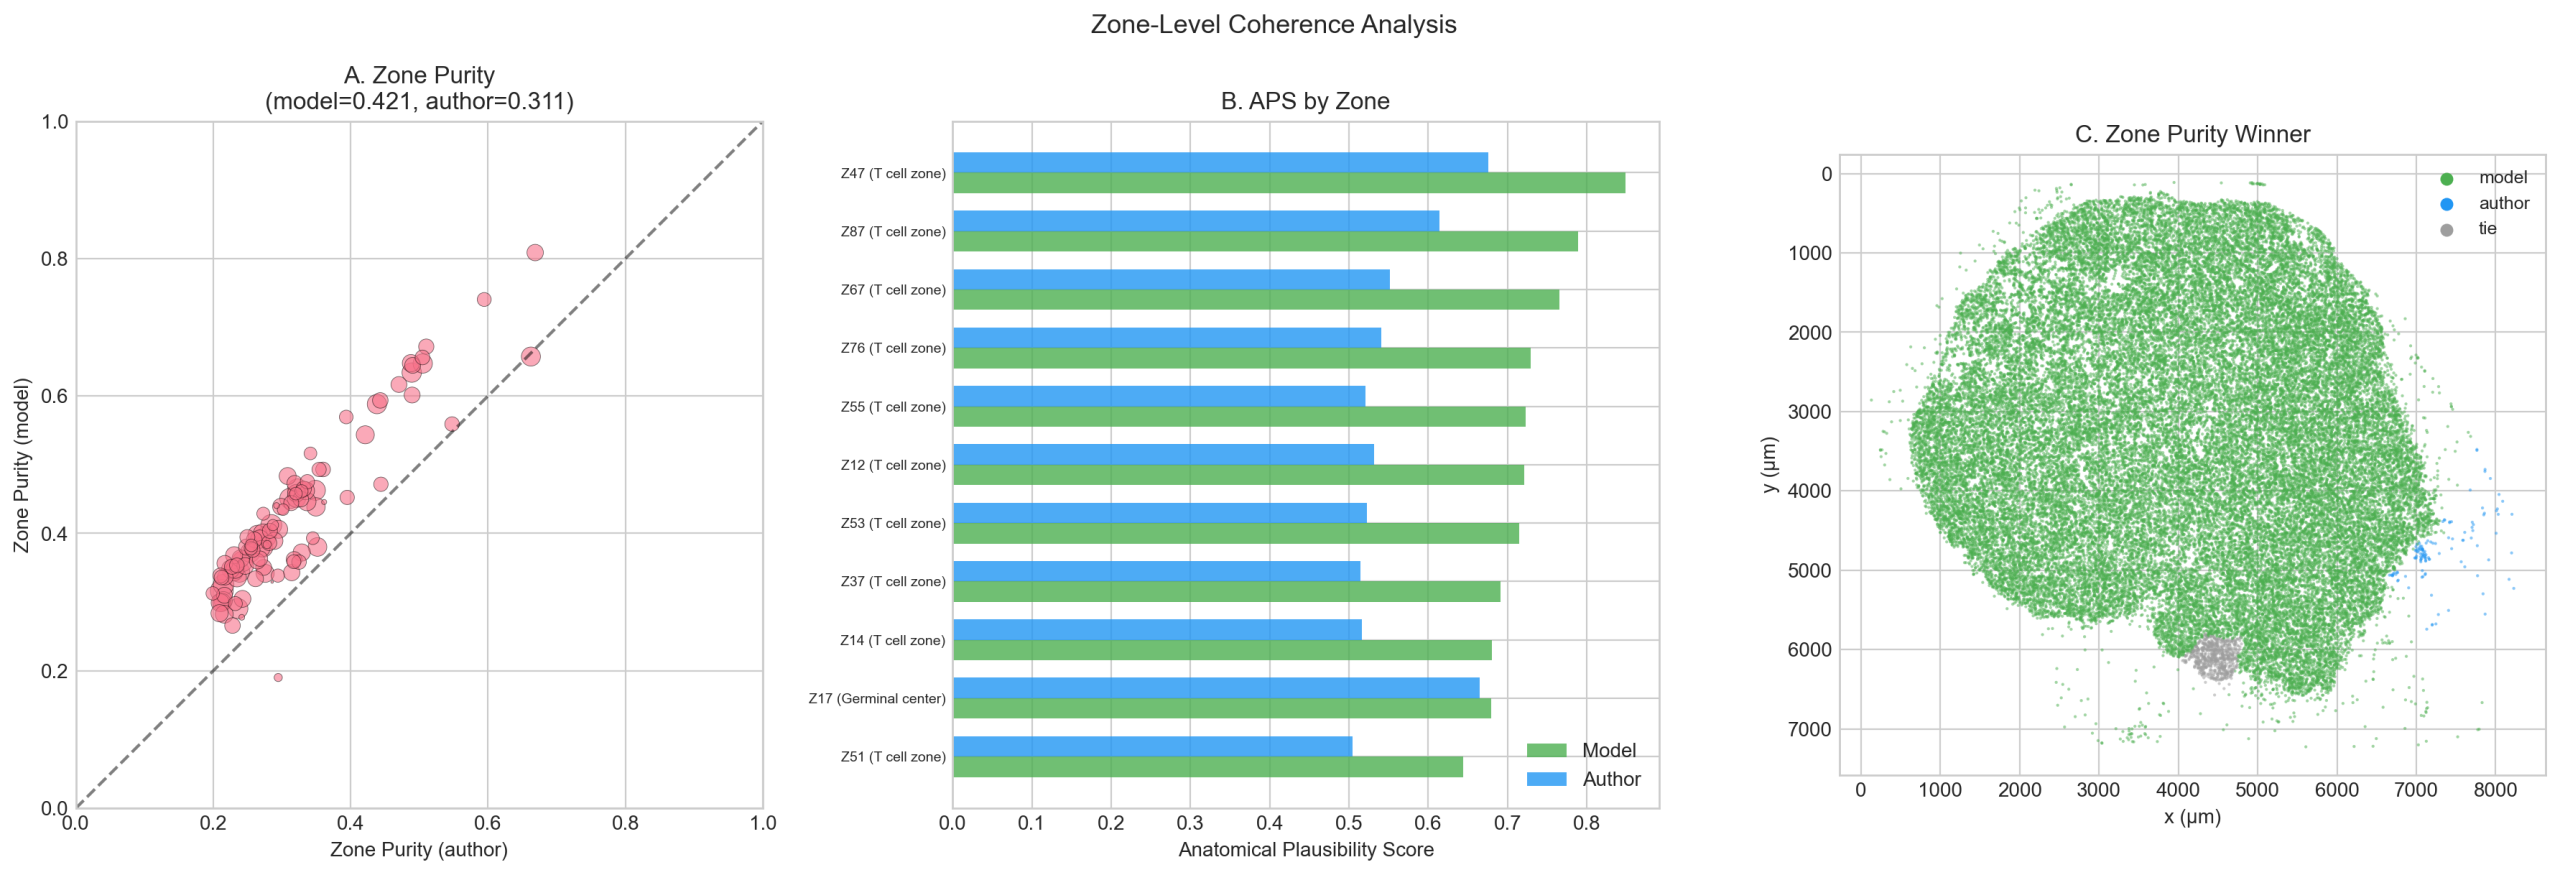
7.5 Zone-Level Analysis
Using the 106 tissue zones discovered by Leiden clustering on the type-weighted spatial graph (from spatial_confidence.ipynb):
| Metric | Model | Author |
|---|---|---|
| Zone purity (weighted mean) | 0.421 | 0.312 |
| APS (11 anatomy-labeled zones) | 0.721 | 0.560 |
Zone purity measures the dominant type fraction within each zone. Model labels win 104 of 106 zones. The Anatomical Plausibility Score (APS) evaluates whether zone composition matches expected lymph node microanatomy — e.g., germinal center zones should be enriched for B cells + DCs, T cell zones for T cells + DCs + pDCs. Model labels produce more anatomically plausible zone composition across all 11 labeled zones.
Caveat: Zones were discovered using model_broad edge weights, creating potential bias toward model labels. The zone-free per-cell metrics (ENS, entropy) do not share this limitation and should be weighted more heavily.
7.6 Interpretation
The STAC analysis provides an independent, ground-truth-free validation axis. The key findings are:
- Neighborhood organization strongly favors model labels: 76.5% of cells have lower neighborhood entropy under model labels (d=0.70), meaning model labels produce spatially more organized tissue structure.
- Zone-level coherence overwhelmingly favors model labels: Model labels produce higher zone purity (0.42 vs 0.31) and more anatomically plausible zone composition (APS 0.72 vs 0.56).
- Type-level patterns align with prior findings: The model’s largest spatial advantages are in the same populations identified as annotation errors in Section 5 (HSC, ILC, Naive CD4), while author advantages concentrate in plasma and stromal cells.
The spatial evidence converges with all prior validation methods: model labels produce tissue architecture that is at least as spatially coherent as author labels at the per-cell level, and substantially more coherent at the zone level. Given that neither method used spatial information during labeling, this provides independent confirmation that the model’s annotations better reflect the true biological organization of the tissue.
8. Conclusions
Accuracy Is Higher Than Raw Metrics Suggest
- Raw h-F1 of 0.763 rises to 0.813 after partially correcting validated author errors and collapsing ontology equivalences — a 5.0 percentage point improvement without changing any model predictions
- These corrections only covered a single author label (naive CD4 T cell) and known ontology equivalences; the remaining gap is likely dominated by uncorrected author errors in other labels, resolution mismatch (the model predicts 365 types vs 28 author labels), and residual spatial artifacts at tissue boundaries
Annotation Pipelines Introduce Systematic Errors
- Cell cycle confounding: HVG selection over-represents cell cycle genes (1.8x enrichment), which PCA concentrates into the components that Leiden uses for clustering, creating artificial T cell subtypes that differ in cell cycle phase rather than lineage
- Segmentation confounding: Small cells at tissue boundaries pick up transcripts from neighboring cells of different types, and these contamination transcripts are HVGs that disproportionately influence PCA-based clustering
- The model avoids both failure modes by using the full transcriptome (4,624 genes) weighted by gene embeddings rather than the HVG-PCA-compressed representation
Spatial Artifacts Are the Dominant Error Source
- Of the four identified error mechanisms, three are spatial in nature (segmentation bleed-through, noisy interfaces, malignant predictions), together affecting ~23K cells
- Malignant predictions traced to ~14% differential transcript depletion in dense B cell regions
- These are the hardest to correct because they stem from physical limitations of the cell segmentation algorithm rather than bioinformatic choices
Model Resolution Exceeds Author Label Resolution
- The 15x increase in type vocabulary (425 vs 28 types) means the model captures biological heterogeneity invisible to the author annotations — subtypes of B cells, T cells, endothelial cells, and macrophages collapsed into single categories by the vendor
- This resolution advantage is both a strength (more informative predictions) and a source of apparent “error” when evaluated against coarse author labels
Spatial Coherence Provides Ground-Truth-Free Confirmation
- Model labels produce more organized neighborhoods (76.5% of cells have lower entropy, d=0.70), higher zone purity (0.42 vs 0.31), and more anatomically plausible zone composition (APS 0.72 vs 0.56)
- Type-level patterns align with all prior findings: model advantages concentrate in populations previously identified as annotation errors (HSC, ILC, Naive CD4)
- Since neither method used spatial information during labeling, spatial coherence represents a truly orthogonal line of evidence
Ready to Classify Your Cells?
See how MiraTyper can deliver accurate, reproducible cell type annotations on your datasets.